Sallie Mae 2005 Annual Report Download - page 186
Download and view the complete annual report
Please find page 186 of the 2005 Sallie Mae annual report below. You can navigate through the pages in the report by either clicking on the pages listed below, or by using the keyword search tool below to find specific information within the annual report.-
 1
1 -
2
-
3
-
4
-
5
-
6
-
7
-
8
-
9
-
10
-
11
-
12
-
13
-
14
-
15
-
16
-
17
-
18
-
19
-
20
-
21
-
22
-
23
-
24
-
25
-
26
-
27
-
28
-
29
-
30
-
31
-
32
-
33
-
34
-
35
-
36
-
37
-
38
-
39
-
40
-
41
-
42
-
43
-
44
-
45
-
46
-
47
-
48
-
49
-
50
-
51
-
52
-
53
-
54
-
55
-
56
-
57
-
58
-
59
-
60
-
61
-
62
-
63
-
64
-
65
-
66
-
67
-
68
-
69
-
70
-
71
-
72
-
73
-
74
-
75
-
76
-
77
-
78
-
79
-
80
-
81
-
82
-
83
-
84
-
85
-
86
-
87
-
88
-
89
-
90
-
91
-
92
-
93
-
94
-
95
-
96
-
97
-
98
-
99
-
100
-
101
-
102
-
103
-
104
-
105
-
106
-
107
-
108
-
109
-
110
-
111
-
112
-
113
-
114
-
115
-
116
-
117
-
118
-
119
-
120
-
121
-
122
-
123
-
124
-
125
-
126
-
127
-
128
-
129
-
130
-
131
-
132
-
133
-
134
-
135
-
136
-
137
-
138
-
139
-
140
-
141
-
142
-
143
-
144
-
145
-
146
-
147
-
148
-
149
-
150
-
151
-
152
-
153
-
154
-
155
-
156
-
157
-
158
-
159
-
160
-
161
-
162
-
163
-
164
-
165
-
166
-
167
-
168
-
169
-
170
-
171
-
172
-
173
-
174
-
175
-
 176
176 -
 177
177 -
 178
178 -
 179
179 -
 180
180 -
 181
181 -
 182
182 -
 183
183 -
 184
184 -
 185
185 -
 186
186 -
 187
187 -
 188
188 -
 189
189 -
 190
190 -
 191
191 -
 192
192 -
 193
193 -
 194
194 -
 195
195 -
 196
196 -
197
-
198
-
199
-
200
-
201
-
202
-
203
-
204
-
205
-
206
-
207
-
208
-
209
-
210
-
211
-
212
-
213
-
214
 |
 |

SLM CORPORATION
NOTES TO CONSOLIDATED FINANCIAL STATEMENTS (Continued)
(Dollars in thousands, except per share amounts, unless otherwise stated)
F-64
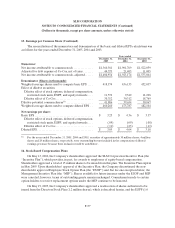
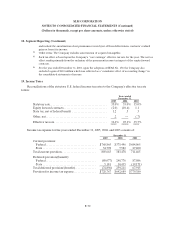
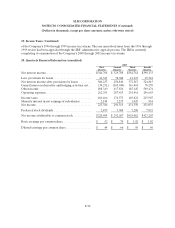
17. Benefit Plans (Continued)
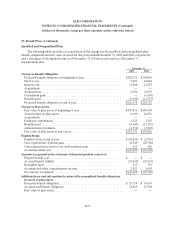
The accumulated benefit obligations of the qualified and nonqualified defined benefit plans were
$211 million and $198 million at December 31, 2005 and 2004, respectively. There are no plan assets in the
nonqualified plans due to the nature of the plans; the corporate assets used to pay these benefits are
included above in employer contributions.
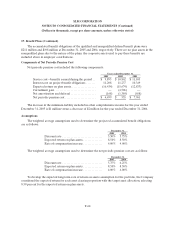
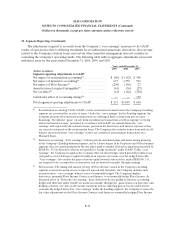
Components of Net Periodic Pension Cost
Net periodic pension cost included the following components:
Years ended December 31,
2005 2004 2003
Service cost—benefits earned during the period . . $ 9,893 $ 10,862 $ 11,103
Interest cost on project benefit obligations....... 11,208 11,237 10,349
Expected return on plan assets.................. (16,434) (15,674) (12,833)
Curtailment gain.............................. — (4,506) —
Net amortization and deferral .................. (168) (1,384) (658)
Net periodic pension cost ...................... $ 4,499 $ 535 $ 7,961
The increase in the minimum liability included in other comprehensive income for the year ended
December 31, 2005 is $1 million versus a decrease of $2 million for the year ended December 31, 2004.
Assumptions
The weighted average assumptions used to determine the projected accumulated benefit obligations
are as follows:
December 31,
2005 2004
Discount rate ............................. 5.50% 5.75%
Expected return on plan assets.............. 8.50% 8.50%
Rate of compensation increase.............. 4.00% 4.00%
The weighted average assumptions used to determine the net periodic pension cost are as follows:
December 31,
2005 2004
Discount rate ............................. 5.75% 6.25%
Expected return on plan assets.............. 8.50% 8.50%
Rate of compensation increase.............. 4.00% 4.00%
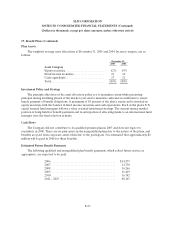
To develop the expected long-term rate of return on assets assumption for the portfolio, the Company
considered the expected return for each asset class in proportion with the target asset allocation, selecting
8.50 percent for the expected return on plan assets.