Sallie Mae 2005 Annual Report Download - page 71
Download and view the complete annual report
Please find page 71 of the 2005 Sallie Mae annual report below. You can navigate through the pages in the report by either clicking on the pages listed below, or by using the keyword search tool below to find specific information within the annual report.-
 1
1 -
2
-
3
-
4
-
5
-
6
-
7
-
8
-
9
-
10
-
11
-
12
-
13
-
14
-
15
-
16
-
17
-
18
-
19
-
20
-
21
-
22
-
23
-
24
-
25
-
26
-
27
-
28
-
29
-
30
-
31
-
32
-
33
-
34
-
35
-
36
-
37
-
38
-
39
-
40
-
41
-
42
-
43
-
44
-
45
-
46
-
47
-
48
-
49
-
50
-
51
-
52
-
53
-
54
-
55
-
56
-
57
-
58
-
59
-
60
-
 61
61 -
 62
62 -
 63
63 -
 64
64 -
 65
65 -
 66
66 -
 67
67 -
 68
68 -
 69
69 -
 70
70 -
 71
71 -
 72
72 -
 73
73 -
 74
74 -
 75
75 -
 76
76 -
 77
77 -
 78
78 -
 79
79 -
 80
80 -
 81
81 -
82
-
83
-
84
-
85
-
86
-
87
-
88
-
89
-
90
-
91
-
92
-
93
-
94
-
95
-
96
-
97
-
98
-
99
-
100
-
101
-
102
-
103
-
104
-
105
-
106
-
107
-
108
-
109
-
110
-
111
-
112
-
113
-
114
-
115
-
116
-
117
-
118
-
119
-
120
-
121
-
122
-
123
-
124
-
125
-
126
-
127
-
128
-
129
-
130
-
131
-
132
-
133
-
134
-
135
-
136
-
137
-
138
-
139
-
140
-
141
-
142
-
143
-
144
-
145
-
146
-
147
-
148
-
149
-
150
-
151
-
152
-
153
-
154
-
155
-
156
-
157
-
158
-
159
-
160
-
161
-
162
-
163
-
164
-
165
-
166
-
167
-
168
-
169
-
170
-
171
-
172
-
173
-
174
-
175
-
176
-
177
-
178
-
179
-
180
-
181
-
182
-
183
-
184
-
185
-
186
-
187
-
188
-
189
-
190
-
191
-
192
-
193
-
194
-
195
-
196
-
197
-
198
-
199
-
200
-
201
-
202
-
203
-
204
-
205
-
206
-
207
-
208
-
209
-
210
-
211
-
212
-
213
-
214
 |
 |

61
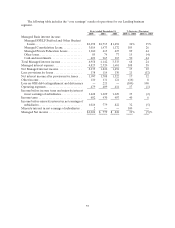
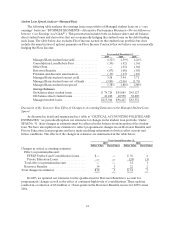
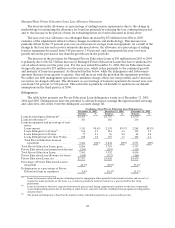
Student Loan Spread Analysis—Managed Basis
The following table analyzes the earnings from our portfolio of Managed student loans on a “core
earnings” basis (see “BUSINESS SEGMENTS—Alternative Performance Measures—Pre-tax differences
between ‘Core Earnings’ and GAAP”). This presentation includes both on-balance sheet and off-balance
sheet student loans and derivatives that are economically hedging the student loans on the debt funding
such loans. The table below also excludes Floor Income earned on the student loan portfolio but does
include the amortization of upfront payments on Floor Income Contracts that we believe our economically
hedging the Floor Income.
Years ended December 31,
2005 2004 2003
Managed Basis student loan yield................ 6.32% 4.59% 4.26 %
Consolidation Loan Rebate Fees ................ (.50) (.42) (.36 )
Offset Fees.................................... — (.02) (.04 )
Borrower Benefits ............................. (.07) (.08) (.05 )
Premium anddiscount amortization.............. (.17) (.13) (.10 )
Managed Basis student loan net yield............. 5.58 3.94 3.71
Managed Basis student loan cost of funds......... (3.80) (2.06) (1.71 )
Managed Basis student loan spread .............. 1.78% 1.88% 2.00 %
Average Balances
On-balance sheet student loans .................. $ 74,724 $55,885 $ 45,127
Off-balance sheet student loans.................. 41,220 40,558 38,205
Managed student loans......................... $115,944 $96,443 $ 83,332
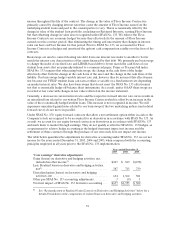
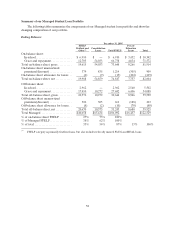
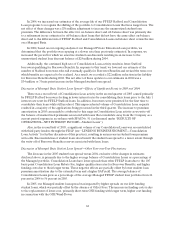
Discussion of the Year-over-Year Effect of Changes in Accounting Estimates on the Managed Student Loan
Spread
As discussed in detail and summarized in a table at “CRITICAL ACCOUNTING POLICIES AND
ESTIMATES,” we periodically update our estimates for changes in the student loan portfolio. Under
SFAS No. 91, these changes in estimates must be reflected in the balance from inception of the student
loan. We have also updated our estimates to reflect programmatic changes in our Borrower Benefits and
Private Education Loan programs and have made modeling refinements to better reflect current and
future conditions. The effects of the changes in estimates are summarized in the table below:
Years Ended December 31,
2005 2004
Dollar Value Basis Points Dollar Value Basis Points
Changes in critical accounting estimates:
Effect on premium/discount:
FFELP Stafford and Consolidation Loans..... $— — $ 36 4
Private Education Loans.................... — — (24) (3)
Total effect on premium/discount .............. — — 12 1
Borrower Benefits............................ 34 3 22 2
Total changes in estimates....................... $34 3 $ 34 3
In 2005, we updated our estimates for the qualification for Borrower Benefits to account for
programmatic changes as well as the effect of continued high levels of consolidations. These updates
resulted in a reduction of $34 million or 3 basis points in the Borrower Benefits reserve for 2005 versus
2004.