Sallie Mae 2005 Annual Report Download - page 83
Download and view the complete annual report
Please find page 83 of the 2005 Sallie Mae annual report below. You can navigate through the pages in the report by either clicking on the pages listed below, or by using the keyword search tool below to find specific information within the annual report.-
 1
1 -
2
-
3
-
4
-
5
-
6
-
7
-
8
-
9
-
10
-
11
-
12
-
13
-
14
-
15
-
16
-
17
-
18
-
19
-
20
-
21
-
22
-
23
-
24
-
25
-
26
-
27
-
28
-
29
-
30
-
31
-
32
-
33
-
34
-
35
-
36
-
37
-
38
-
39
-
40
-
41
-
42
-
43
-
44
-
45
-
46
-
47
-
48
-
49
-
50
-
51
-
52
-
53
-
54
-
55
-
56
-
57
-
58
-
59
-
60
-
61
-
62
-
63
-
64
-
65
-
66
-
67
-
68
-
69
-
70
-
71
-
72
-
 73
73 -
 74
74 -
 75
75 -
 76
76 -
 77
77 -
 78
78 -
 79
79 -
 80
80 -
 81
81 -
 82
82 -
 83
83 -
 84
84 -
 85
85 -
 86
86 -
 87
87 -
 88
88 -
 89
89 -
 90
90 -
 91
91 -
 92
92 -
 93
93 -
94
-
95
-
96
-
97
-
98
-
99
-
100
-
101
-
102
-
103
-
104
-
105
-
106
-
107
-
108
-
109
-
110
-
111
-
112
-
113
-
114
-
115
-
116
-
117
-
118
-
119
-
120
-
121
-
122
-
123
-
124
-
125
-
126
-
127
-
128
-
129
-
130
-
131
-
132
-
133
-
134
-
135
-
136
-
137
-
138
-
139
-
140
-
141
-
142
-
143
-
144
-
145
-
146
-
147
-
148
-
149
-
150
-
151
-
152
-
153
-
154
-
155
-
156
-
157
-
158
-
159
-
160
-
161
-
162
-
163
-
164
-
165
-
166
-
167
-
168
-
169
-
170
-
171
-
172
-
173
-
174
-
175
-
176
-
177
-
178
-
179
-
180
-
181
-
182
-
183
-
184
-
185
-
186
-
187
-
188
-
189
-
190
-
191
-
192
-
193
-
194
-
195
-
196
-
197
-
198
-
199
-
200
-
201
-
202
-
203
-
204
-
205
-
206
-
207
-
208
-
209
-
210
-
211
-
212
-
213
-
214
 |
 |

73
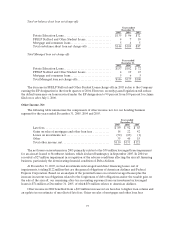
Total on-balance sheet loan net charge-offs
Years ended
December 31,
2005 2004 2003
Private Education Loans.................................. $135 $ 96 $72
FFELP Stafford and Other Student Loans .................. 4 7 10
Mortgage and consumer loans............................. 5 6 5
Total on-balance sheet loan net charge-offs ................. $144 $109 $87
Total Managed loan net charge-offs
Years ended
December 31,
2005 2004 2003
PrivateEducationLoans.................................. $137 $102 $ 72
FFELP Stafford and Other Student Loans .................. 4 19 23
Mortgage and consumer loans............................. 5 6 5
Total Managed loannet charge-offs........................ $146 $127 $100
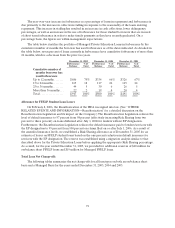
The decrease in FFELP Stafford and Other Student Loans charge-offs in 2005 is due to the Company
earning the EP designation in the fourth quarter of 2004. However, recently passed legislation will reduce
the default insurance on loans serviced under the EP designation to 99 percent from 100 percent for claims
filed on or after July 1, 2006.
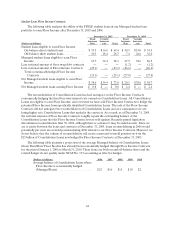
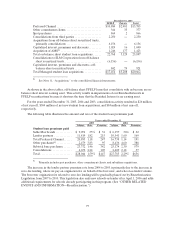
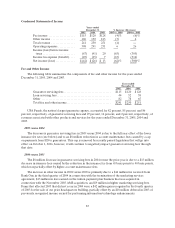
Other Income, Net
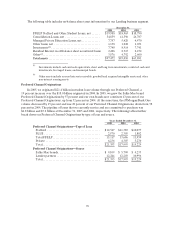
The following table summarizes the components of other income, net, for our Lending business
segment for the years ended December 31, 2005, 2004 and 2003.
Years ended
December 31,
2005 2004 2003
Latefees............................................... $ 89 $ 92 $ 65
Gains on sales of mortgages and other loan fees ............ 18 22 42
Losseson investments, net............................... (32) (23) (1 )
Other 35 40 15
Total other income, net.................................. $110 $131 $121
The net losses on investments in 2005 primarily relates to the $39 million leveraged lease impairment
for an aircraft leased to Northwest Airlines, which declared bankruptcy in September 2005. In 2004 we
recorded a $27 million impairment in recognition of the adverse conditions affecting the aircraft financing
business, particularly the deteriorating financial condition of Delta Airlines.
At December 31, 2005, we had investments in leveraged and direct financing leases, net of
impairments, totaling $122 million that are the general obligations of American Airlines and Federal
Express Corporation. Based on an analysis of the potential losses on certain leveraged leases plus the
increase in current tax obligations related to the forgiveness of debt obligations and/or the taxable gain on
the sale of the aircraft, our remaining after-tax accounting exposure from our investment in leveraged
leases is $74 million at December 31, 2005, of which $56 million relates to American Airlines.
Other income in 2004 benefited from a $29 million increase in late fees due to higher loan volume and
an update in our estimate of uncollected late fees. Gains on sales of mortgages and other loan fees