Sallie Mae 2005 Annual Report Download - page 22
Download and view the complete annual report
Please find page 22 of the 2005 Sallie Mae annual report below. You can navigate through the pages in the report by either clicking on the pages listed below, or by using the keyword search tool below to find specific information within the annual report.-
 1
1 -
2
-
3
-
4
-
5
-
6
-
7
-
8
-
9
-
10
-
11
-
 12
12 -
 13
13 -
 14
14 -
 15
15 -
 16
16 -
 17
17 -
 18
18 -
 19
19 -
 20
20 -
 21
21 -
 22
22 -
 23
23 -
 24
24 -
 25
25 -
 26
26 -
 27
27 -
 28
28 -
 29
29 -
 30
30 -
 31
31 -
 32
32 -
33
-
34
-
35
-
36
-
37
-
38
-
39
-
40
-
41
-
42
-
43
-
44
-
45
-
46
-
47
-
48
-
49
-
50
-
51
-
52
-
53
-
54
-
55
-
56
-
57
-
58
-
59
-
60
-
61
-
62
-
63
-
64
-
65
-
66
-
67
-
68
-
69
-
70
-
71
-
72
-
73
-
74
-
75
-
76
-
77
-
78
-
79
-
80
-
81
-
82
-
83
-
84
-
85
-
86
-
87
-
88
-
89
-
90
-
91
-
92
-
93
-
94
-
95
-
96
-
97
-
98
-
99
-
100
-
101
-
102
-
103
-
104
-
105
-
106
-
107
-
108
-
109
-
110
-
111
-
112
-
113
-
114
-
115
-
116
-
117
-
118
-
119
-
120
-
121
-
122
-
123
-
124
-
125
-
126
-
127
-
128
-
129
-
130
-
131
-
132
-
133
-
134
-
135
-
136
-
137
-
138
-
139
-
140
-
141
-
142
-
143
-
144
-
145
-
146
-
147
-
148
-
149
-
150
-
151
-
152
-
153
-
154
-
155
-
156
-
157
-
158
-
159
-
160
-
161
-
162
-
163
-
164
-
165
-
166
-
167
-
168
-
169
-
170
-
171
-
172
-
173
-
174
-
175
-
176
-
177
-
178
-
179
-
180
-
181
-
182
-
183
-
184
-
185
-
186
-
187
-
188
-
189
-
190
-
191
-
192
-
193
-
194
-
195
-
196
-
197
-
198
-
199
-
200
-
201
-
202
-
203
-
204
-
205
-
206
-
207
-
208
-
209
-
210
-
211
-
212
-
213
-
214
 |
 |
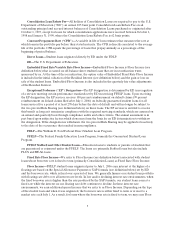
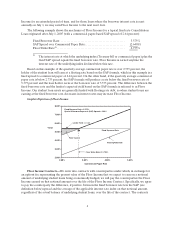
12
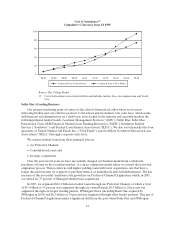
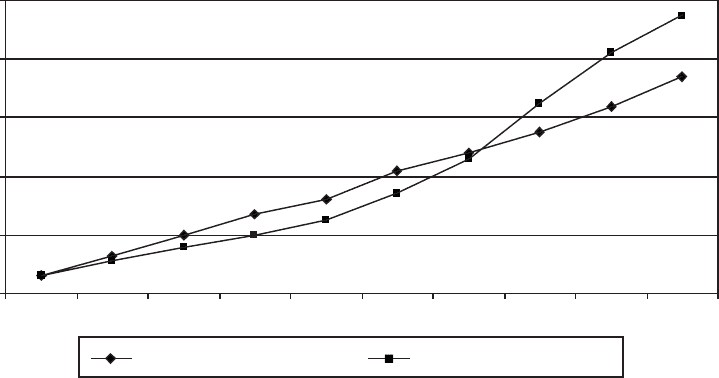
Cost of Attendance(1)
Cumulative % Increase from AY 1995
0
20
40
60
80
100
96-97 97-98 98-99 99-00 00-01 01-02 02-03 03-04 04-05 05-06
Tuition & Fees 4-Year Private Tuition & Fees 4-Year Public
Source: The College Board
(1) Cost of attendance is in current dollars and includes tuition, fees, on-campus room and board
fees.
Sallie Mae’s Lending Business
Our primary marketing point-of-contact is the school’s financial aid office where we focus on
delivering flexible and cost-effective products to the school and its students. Our sales force, which works
with financial aid administrators on a daily basis, is the largest in the industry and currently markets the
following internal lender brands: Academic Management Services (“AMS”), Nellie Mae, Sallie Mae
Educational Trust, SLM Financial, Student Loan Funding Resources (“SLFR”), Southwest Student
Services (“Southwest”) and Student Loan Finance Association (“SLFA”). We also actively market the loan
guarantee of United Student Aid Funds, Inc. (“USA Funds”) and its affiliate Northwest Education Loan
Association (“NELA”) through a separate sales force.
We acquire student loans from three principal sources:
•our Preferred Channel;
•Consolidation Loans; and
• strategic acquisitions.
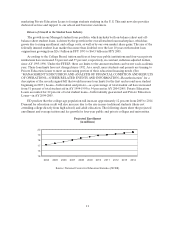
Over the past several years we have successfully changed our business model from a wholesale
purchaser of loans on the secondary market, to a direct origination model where we control the front-end
origination process. This provides us with higher yielding loans with lower acquisition costs that have a
longer duration because we originate or purchase them at or immediately after full disbursement. The key
measure of this successful transition is the growth in our Preferred Channel Originations, which, in 2005,
accounted for 75 percent of Managed student loan acquisitions.
In 2005, we originated $21.4 billion in student loans through our Preferred Channel, of which a total
of $9.1 billion or 43 percent was originated through our owned brands, $5.9 billion or 28 percent was
originated through our largest lending partner, JPMorgan Chase (including Bank One acquired by
JPMorgan in 2004) and $6.3 billion or 30 percent was originated through other lender partners. This mix of
Preferred Channel Originations marks a significant shift from the past, when Bank One and JPMorgan