Sallie Mae 2005 Annual Report Download - page 55
Download and view the complete annual report
Please find page 55 of the 2005 Sallie Mae annual report below. You can navigate through the pages in the report by either clicking on the pages listed below, or by using the keyword search tool below to find specific information within the annual report.-
 1
1 -
2
-
3
-
4
-
5
-
6
-
7
-
8
-
9
-
10
-
11
-
12
-
13
-
14
-
15
-
16
-
17
-
18
-
19
-
20
-
21
-
22
-
23
-
24
-
25
-
26
-
27
-
28
-
29
-
30
-
31
-
32
-
33
-
34
-
35
-
36
-
37
-
38
-
39
-
40
-
41
-
42
-
43
-
44
-
 45
45 -
 46
46 -
 47
47 -
 48
48 -
 49
49 -
 50
50 -
 51
51 -
 52
52 -
 53
53 -
 54
54 -
 55
55 -
 56
56 -
 57
57 -
 58
58 -
 59
59 -
 60
60 -
 61
61 -
 62
62 -
 63
63 -
 64
64 -
 65
65 -
66
-
67
-
68
-
69
-
70
-
71
-
72
-
73
-
74
-
75
-
76
-
77
-
78
-
79
-
80
-
81
-
82
-
83
-
84
-
85
-
86
-
87
-
88
-
89
-
90
-
91
-
92
-
93
-
94
-
95
-
96
-
97
-
98
-
99
-
100
-
101
-
102
-
103
-
104
-
105
-
106
-
107
-
108
-
109
-
110
-
111
-
112
-
113
-
114
-
115
-
116
-
117
-
118
-
119
-
120
-
121
-
122
-
123
-
124
-
125
-
126
-
127
-
128
-
129
-
130
-
131
-
132
-
133
-
134
-
135
-
136
-
137
-
138
-
139
-
140
-
141
-
142
-
143
-
144
-
145
-
146
-
147
-
148
-
149
-
150
-
151
-
152
-
153
-
154
-
155
-
156
-
157
-
158
-
159
-
160
-
161
-
162
-
163
-
164
-
165
-
166
-
167
-
168
-
169
-
170
-
171
-
172
-
173
-
174
-
175
-
176
-
177
-
178
-
179
-
180
-
181
-
182
-
183
-
184
-
185
-
186
-
187
-
188
-
189
-
190
-
191
-
192
-
193
-
194
-
195
-
196
-
197
-
198
-
199
-
200
-
201
-
202
-
203
-
204
-
205
-
206
-
207
-
208
-
209
-
210
-
211
-
212
-
213
-
214
 |
 |

45
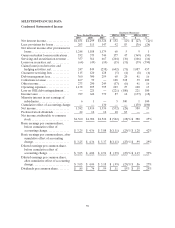
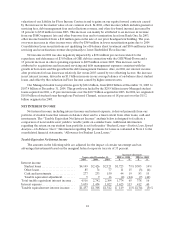
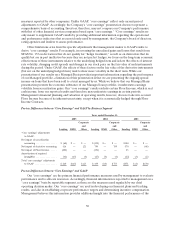
Discussion of Student Loan Spread—Effects of Floor Income and Derivative Accounting
One of the primary drivers of fluctuations in our on-balance sheet student loan spread is the level of
gross Floor Income earned in the period. In 2005, 2004 and 2003, we earned gross Floor Income of
$187 million (25 basis points), $408 million (73 basis points) and $554 million (123 basis points),
respectively. Gross Floor Income is the amount of Floor Income earned on our on-balance sheet portfolio
of student loans without giving effect to payments under our Floor Income Contracts, which is discussed in
more detail below. The reduction in gross Floor Income is due to the increase in short-term interest rates.
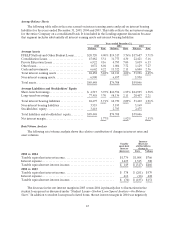
We believe that we have economically hedged most of the Floor Income through the sale of Floor Income
Contracts, under which we receive an upfront fee and agree to pay the counterparty the Floor Income
earned on a notional amount of student loans. These contracts do not qualify for accounting hedge
treatment and as a result the payments on the Floor Income Contracts are included on the income
statement with “gains (losses) on derivative and hedging activities, net” rather than in student loan interest
income. For the years ended December 31, 2005, 2004 and 2003, net Floor Income for on-balance sheet
student loans was $12 million (2 basis points), $40 million (7 basis points) and $146 million (32 basis
points), respectively. Payments on Floor Income Contracts associated with on-balance sheet student loans
for the years ended December 31, 2005, 2004 and 2003 totaled $175 million (23 basis points), $368 million
(66 basis points) and $408 million (91 basis points), respectively.
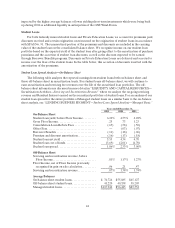
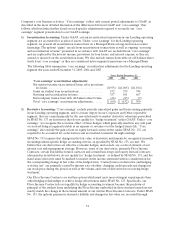
In addition to Floor Income Contracts, we also extensively use basis swaps to manage our basis risk
associated with interest rate sensitive assets and liabilities. These swaps generally do not qualify as
accounting hedges and are likewise required to be accounted for in the “gains (losses) on derivative and
hedging activities, net” line on the income statement. As a result, they are not considered in the calculation
of the cost of funds in the above table.
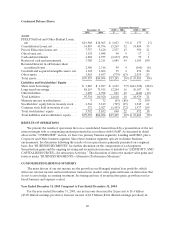
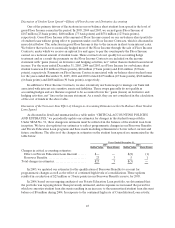
Discussion of the Year-over-Year Effect of Changes in Accounting Estimates on the On-Balance Sheet Student
Loan Spread
As discussed in detail and summarized in a table under “CRITICAL ACCOUNTING POLICIES
AND ESTIMATES,” we periodically update our estimates for changes in the student loan portfolio.
Under SFAS No. 91, these changes in estimates must be reflected in the balance of the student loan from
inception. We have also updated our estimates to reflect programmatic changes in our Borrower Benefits
and Private Education Loan programs and have made modeling refinements to better reflect current and
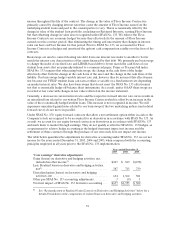
future conditions. The effects of the changes in estimates on the student loan spread are summarized in the
table below:
Years Ended December 31,
2005 2004
Dollar Value Basis Points Dollar Value Basis Points
Changes in critical accounting estimates:
Effect onPrivate Education Loan discount...... $— — $(8) (1)
Borrower Benefits............................ 23 3 5 1
Total changes in estimates....................... $23 3 $(3) —
In 2005, we updated our estimates for the qualification of Borrower Benefits to account for
programmatic changes as well as the effect of continued high levels of consolidations. These updates
resulted in a reduction of $23 million or 3 basis points in our Borrower Benefits reserve for 2005.
In 2004, based on our ongoing analysis of our Private Education Loan portfolio, we determined that
the portfolio was repaying slower than previously estimated, and in response we increased the period for
which we amortize student loan discounts resulting in an increase to the unamortized student loan discount
balance of $8 million during 2004. In response to the continued high rate of Consolidation Loan activity,