Sallie Mae 2005 Annual Report Download - page 177
Download and view the complete annual report
Please find page 177 of the 2005 Sallie Mae annual report below. You can navigate through the pages in the report by either clicking on the pages listed below, or by using the keyword search tool below to find specific information within the annual report.-
 1
1 -
2
-
3
-
4
-
5
-
6
-
7
-
8
-
9
-
10
-
11
-
12
-
13
-
14
-
15
-
16
-
17
-
18
-
19
-
20
-
21
-
22
-
23
-
24
-
25
-
26
-
27
-
28
-
29
-
30
-
31
-
32
-
33
-
34
-
35
-
36
-
37
-
38
-
39
-
40
-
41
-
42
-
43
-
44
-
45
-
46
-
47
-
48
-
49
-
50
-
51
-
52
-
53
-
54
-
55
-
56
-
57
-
58
-
59
-
60
-
61
-
62
-
63
-
64
-
65
-
66
-
67
-
68
-
69
-
70
-
71
-
72
-
73
-
74
-
75
-
76
-
77
-
78
-
79
-
80
-
81
-
82
-
83
-
84
-
85
-
86
-
87
-
88
-
89
-
90
-
91
-
92
-
93
-
94
-
95
-
96
-
97
-
98
-
99
-
100
-
101
-
102
-
103
-
104
-
105
-
106
-
107
-
108
-
109
-
110
-
111
-
112
-
113
-
114
-
115
-
116
-
117
-
118
-
119
-
120
-
121
-
122
-
123
-
124
-
125
-
126
-
127
-
128
-
129
-
130
-
131
-
132
-
133
-
134
-
135
-
136
-
137
-
138
-
139
-
140
-
141
-
142
-
143
-
144
-
145
-
146
-
147
-
148
-
149
-
150
-
151
-
152
-
153
-
154
-
155
-
156
-
157
-
158
-
159
-
160
-
161
-
162
-
163
-
164
-
165
-
166
-
 167
167 -
 168
168 -
 169
169 -
 170
170 -
 171
171 -
 172
172 -
 173
173 -
 174
174 -
 175
175 -
 176
176 -
 177
177 -
 178
178 -
 179
179 -
 180
180 -
 181
181 -
 182
182 -
 183
183 -
 184
184 -
 185
185 -
 186
186 -
 187
187 -
188
-
189
-
190
-
191
-
192
-
193
-
194
-
195
-
196
-
197
-
198
-
199
-
200
-
201
-
202
-
203
-
204
-
205
-
206
-
207
-
208
-
209
-
210
-
211
-
212
-
213
-
214
 |
 |

SLM CORPORATION
NOTES TO CONSOLIDATED FINANCIAL STATEMENTS (Continued)
(Dollars in thousands, except per share amounts, unless otherwise stated)
F-55
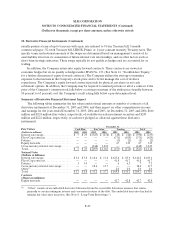
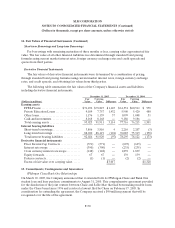
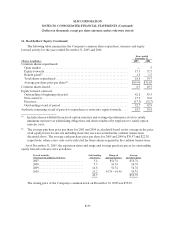
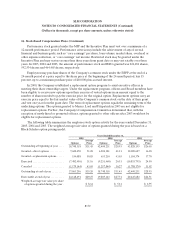
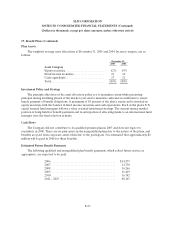
14. Stockholders’ Equity (Continued)
The following table summarizes the Company’s common share repurchase, issuance and equity
forward activity for the years ended December 31, 2005 and 2004.
Years ended
December 31,
(Shares in millions) 2005 2004
Common shares repurchased:
Open market.............................................................. — .5
Equity forwards ............................................................ 17.3 32.7
Benefit plans(1) ............................................................. 1.5 1.5
Totalsharesrepurchased.................................................... 18.8 34.7
Average purchase price per share(2) ........................................... $49.94 $38.03
Common shares issued........................................................ 8.3 10.7
Equity forward contracts:
Outstanding at beginning of period........................................... 42.8 43.5
Newcontracts ............................................................. 17.2 32.0
Exercises.................................................................. (17.3) (32.7)
Outstanding at end of period ................................................ 42.7 42.8
Authority remaining at end of period to repurchase or enter into equity forwards..... 18.7 35.8
(1) Includes shares withheld from stock option exercises and vesting of performance stock to satisfy
minimum statutory tax withholding obligations and shares tendered by employees to satisfy option
exercise costs.
(2) The average purchase price per share for 2005 and 2004 is calculated based on the average strike price
of all equity forward contracts including those that were net settled in the cashless transactions
discussed above. The average cash purchase price per share for 2005 and 2004 is $38.97 and $22.38,
respectively, when a zero cash cost is reflected for those shares acquired in the cashless transactions.
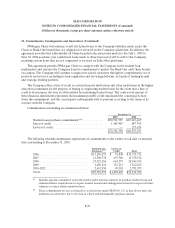
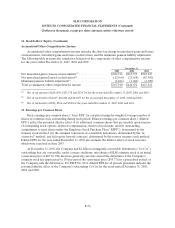
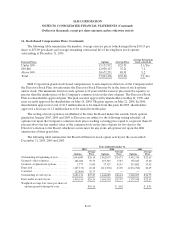
As of December 31, 2005, the expiration dates and range and average purchase prices for outstanding
equity forward contracts were as follows:
Year of maturity
(Contracts in millions of shares)
Outstanding
Contracts
Range of
purchase prices
Average
purchase price
2007................................ 5.4 $54.74 $54.74
2008................................ 7.3 54.74 54.74
2009................................ 14.8 54.74 54.74
2010................................ 15.2 54.74 – 54.96 54.74
42.7 $54.74
The closing price of the Company’s common stock on December 30, 2005 was $55.09.