Sallie Mae 2005 Annual Report Download - page 127
Download and view the complete annual report
Please find page 127 of the 2005 Sallie Mae annual report below. You can navigate through the pages in the report by either clicking on the pages listed below, or by using the keyword search tool below to find specific information within the annual report.-
 1
1 -
2
-
3
-
4
-
5
-
6
-
7
-
8
-
9
-
10
-
11
-
12
-
13
-
14
-
15
-
16
-
17
-
18
-
19
-
20
-
21
-
22
-
23
-
24
-
25
-
26
-
27
-
28
-
29
-
30
-
31
-
32
-
33
-
34
-
35
-
36
-
37
-
38
-
39
-
40
-
41
-
42
-
43
-
44
-
45
-
46
-
47
-
48
-
49
-
50
-
51
-
52
-
53
-
54
-
55
-
56
-
57
-
58
-
59
-
60
-
61
-
62
-
63
-
64
-
65
-
66
-
67
-
68
-
69
-
70
-
71
-
72
-
73
-
74
-
75
-
76
-
77
-
78
-
79
-
80
-
81
-
82
-
83
-
84
-
85
-
86
-
87
-
88
-
89
-
90
-
91
-
92
-
93
-
94
-
95
-
96
-
97
-
98
-
99
-
100
-
101
-
102
-
103
-
104
-
105
-
106
-
107
-
108
-
109
-
110
-
111
-
112
-
113
-
114
-
115
-
116
-
 117
117 -
 118
118 -
 119
119 -
 120
120 -
 121
121 -
 122
122 -
 123
123 -
 124
124 -
 125
125 -
 126
126 -
 127
127 -
 128
128 -
 129
129 -
 130
130 -
 131
131 -
 132
132 -
 133
133 -
 134
134 -
 135
135 -
 136
136 -
 137
137 -
138
-
139
-
140
-
141
-
142
-
143
-
144
-
145
-
146
-
147
-
148
-
149
-
150
-
151
-
152
-
153
-
154
-
155
-
156
-
157
-
158
-
159
-
160
-
161
-
162
-
163
-
164
-
165
-
166
-
167
-
168
-
169
-
170
-
171
-
172
-
173
-
174
-
175
-
176
-
177
-
178
-
179
-
180
-
181
-
182
-
183
-
184
-
185
-
186
-
187
-
188
-
189
-
190
-
191
-
192
-
193
-
194
-
195
-
196
-
197
-
198
-
199
-
200
-
201
-
202
-
203
-
204
-
205
-
206
-
207
-
208
-
209
-
210
-
211
-
212
-
213
-
214
 |
 |

See accompanying notes to consolidated financial statements.
F-5
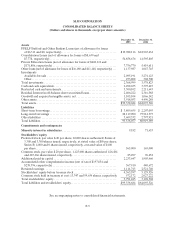
SLM CORPORATION
CONSOLIDATED BALANCE SHEETS
(Dollars and shares in thousands, except per share amounts)
December 31,
2005
December 31,
2004
Assets
FFELP Stafford and Other Student Loans (net of allowance for losses
of $6,311 and $0, respectively) ....................................... $19,988,116 $ 18,965,634
Consolidation Loans (net of allowance for losses of $8,639 and
$7,778, respectively) ................................................ 54,858,676 41,595,805
Private Education Loans (net of allowance for losses of $204,112 and
$171,886, respectively).............................................. 7,756,770 5,419,611
Other loans (net of allowance for losses of $16,180 and $11,148, respectively) . . . 1,137,987 1,047,745
Investments
Available-for-sale.................................................. 2,095,191 3,274,123
Other............................................................. 273,808 304,700
Total investments .................................................... 2,368,999 3,578,823
Cash and cash equivalents............................................. 2,498,655 3,395,487
Restricted cash and investments........................................ 3,300,102 2,211,643
Residual Interest in off-balance sheet securitized loans.................... 2,406,222
2,316,388
Goodwill and acquired intangible assets, net ............................. 1,105,104 1,066,142
Other assets......................................................... 3,918,053 4,496,248
Total assets.......................................................... $99,338,684 $ 84,093,526
Liabilities
Short-term borrowings ................................................ $ 3,809,655 $ 2,207,095
Long-term borrowings ................................................ 88,119,090 75,914,573
Other liabilities...................................................... 3,609,332 2,797,921
Total liabilities....................................................... 95,538,077 80,919,589
Commitments and contingencies
Minority interest in subsidiaries ....................................... 9,182 71,633
Stockholders’ equity
Preferred stock, par value $.20 per share, 20,000 shares authorized; Series A:
3,300 and 3,300 shares issued, respectively, at stated value of $50 per share;
Series B: 4,000 and 0 shares issued, respectively, at stated value of $100
per share.......................................................... 565,000 165,000
Common stock, par value $.20 per share, 1,125,000 shares authorized: 426,484
and 483,266shares issued, respectively................................ 85,297 96,654
Additional paid-in capital ............................................. 2,233,647 1,905,460
Accumulated other comprehensive income (net of tax of $197,834 and
$238,396, respectively).............................................. 367,910 440,672
Retained earnings .................................................... 1,111,743 2,521,740
Stockholders’ equitybefore treasurystock............................... 4,363,597 5,129,526
Common stock held in treasury at cost: 13,347 and 59,634 shares, respectively 572,172 2,027,222
Total stockholders’ equity............................................. 3,791,425 3,102,304
Total liabilities andstockholders’ equity................................. $99,338,684 $ 84,093,526