Sallie Mae 2005 Annual Report Download - page 18
Download and view the complete annual report
Please find page 18 of the 2005 Sallie Mae annual report below. You can navigate through the pages in the report by either clicking on the pages listed below, or by using the keyword search tool below to find specific information within the annual report.-
 1
1 -
2
-
3
-
4
-
5
-
6
-
7
-
 8
8 -
 9
9 -
 10
10 -
 11
11 -
 12
12 -
 13
13 -
 14
14 -
 15
15 -
 16
16 -
 17
17 -
 18
18 -
 19
19 -
 20
20 -
 21
21 -
 22
22 -
 23
23 -
 24
24 -
 25
25 -
 26
26 -
 27
27 -
 28
28 -
29
-
30
-
31
-
32
-
33
-
34
-
35
-
36
-
37
-
38
-
39
-
40
-
41
-
42
-
43
-
44
-
45
-
46
-
47
-
48
-
49
-
50
-
51
-
52
-
53
-
54
-
55
-
56
-
57
-
58
-
59
-
60
-
61
-
62
-
63
-
64
-
65
-
66
-
67
-
68
-
69
-
70
-
71
-
72
-
73
-
74
-
75
-
76
-
77
-
78
-
79
-
80
-
81
-
82
-
83
-
84
-
85
-
86
-
87
-
88
-
89
-
90
-
91
-
92
-
93
-
94
-
95
-
96
-
97
-
98
-
99
-
100
-
101
-
102
-
103
-
104
-
105
-
106
-
107
-
108
-
109
-
110
-
111
-
112
-
113
-
114
-
115
-
116
-
117
-
118
-
119
-
120
-
121
-
122
-
123
-
124
-
125
-
126
-
127
-
128
-
129
-
130
-
131
-
132
-
133
-
134
-
135
-
136
-
137
-
138
-
139
-
140
-
141
-
142
-
143
-
144
-
145
-
146
-
147
-
148
-
149
-
150
-
151
-
152
-
153
-
154
-
155
-
156
-
157
-
158
-
159
-
160
-
161
-
162
-
163
-
164
-
165
-
166
-
167
-
168
-
169
-
170
-
171
-
172
-
173
-
174
-
175
-
176
-
177
-
178
-
179
-
180
-
181
-
182
-
183
-
184
-
185
-
186
-
187
-
188
-
189
-
190
-
191
-
192
-
193
-
194
-
195
-
196
-
197
-
198
-
199
-
200
-
201
-
202
-
203
-
204
-
205
-
206
-
207
-
208
-
209
-
210
-
211
-
212
-
213
-
214
 |
 |
8
businesses. In accordance with SFAS No. 131, we include in Note 18 to our consolidated financial
statements, “Segment Reporting,” separate financial information about our operating segments.
Management, including the Company’s chief operating decision maker, evaluates the performance of
the Company’s operating segments based on their profitability as measured by “core earnings.”
Accordingly, we provide information regarding the Company’s reportable segments in this report based on
“core earnings.” “Core earnings” are the primary financial performance measures used by management to
develop the Company’s financial plans, track results, and establish corporate performance targets and
incentive compensation. While “core earnings” are not a substitute for reported results under generally
accepted accounting principles in the United States (“GAAP”), the Company relies on “core earnings” in
operating its business because “core earnings” permit management to make meaningful period-to-period
comparisons of the operational and performance indicators that are most closely assessed by management.
Management believes this information provides additional insight into the financial performance of the
core business activities of our operating segments. (See MANAGEMENT’S DISCUSSION AND
ANALYSIS OF FINANCIAL CONDITION AND RESULTS OF OPERATIONS—BUSINESS
SEGMENTS” for a detailed discussion of our “core earnings,” including a table that summarizes the pre-
tax differences between “core earnings” and GAAP by business segment and the limitations to this
presentation.)
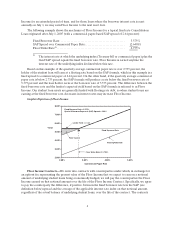
We generate most of our earnings in our Lending business from the spread between the yield we
receive on our Managed portfolio of student loans and the cost of funding these loans less the provisions
for loan losses. We incur servicing, selling and administrative expenses in providing these products and
services, and provide for loan losses. On our income statement, prepared in accordance with GAAP, this
spread income is reported as “net interest income” for on-balance sheet loans, and “gains on student loan
securitizations” and “servicing and securitization revenue” for off-balance sheet loans in which we
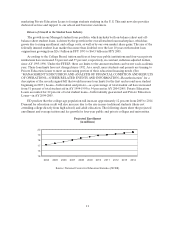
maintain a Retained Interest. Total Managed revenues for this segment were $2.1 billion in 2005.
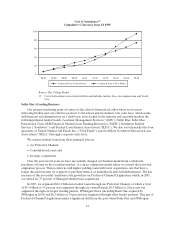
In our DMO business, we earn fee revenue for portfolio management, debt collection and default
prevention services on a contingent fee basis concentrated mainly in the education finance marketplace.
We also purchase delinquent and defaulted consumer and mortgage receivables through AFS and GRP
and earn revenues from collections on these portfolios. Total revenues from the DMO business were
$527 million in 2005.
We recently opened a subsidiary of AFS in the United Kingdom, called Arrow Global Ltd. Through
this subsidiary, we expect to begin purchasing receivables in Europe—principally charged-off consumer
receivables—in 2006.
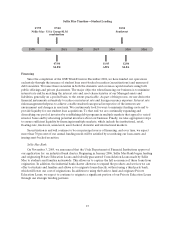
LENDING BUSINESS SEGMENT
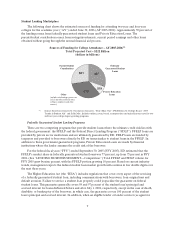
In our Lending business segment, we originate and acquire both federally guaranteed student loans,
which are administered by the U.S. Department of Education (“ED”), and Private Education Loans, which
are not federally guaranteed. Borrowers use Private Education Loans primarily to supplement guaranteed
loans in meeting the cost of education. We manage the largest portfolio of FFELP and Private Education
Loans in the student loan industry, serving nine million borrowers through our ownership and
management of $122.5 billion in Managed student loans, of which $106.1 billion or 87 percent are federally
insured. We serve a diverse range of clients that includes over 6,000 educational and financial institutions
and state agencies. We also market student loans, both federal and private, directly to the consumer. We
are the largest servicer of FFELP student loans, servicing a portfolio of $108.1 billion of FFELP student
loans and $18.8 billion of Private Education Loans. In addition to education lending, we also originate
mortgage and consumer loans with the intent of selling most of these loans. In 2005 we originated
$2 billion in mortgage and consumer loans. Our mortgage and consumer loan portfolio totaled $594
million at December 31, 2005, of which $215 million are mortgages in the held-for-sale portfolio.