Sallie Mae 2005 Annual Report Download - page 189
Download and view the complete annual report
Please find page 189 of the 2005 Sallie Mae annual report below. You can navigate through the pages in the report by either clicking on the pages listed below, or by using the keyword search tool below to find specific information within the annual report.-
 1
1 -
2
-
3
-
4
-
5
-
6
-
7
-
8
-
9
-
10
-
11
-
12
-
13
-
14
-
15
-
16
-
17
-
18
-
19
-
20
-
21
-
22
-
23
-
24
-
25
-
26
-
27
-
28
-
29
-
30
-
31
-
32
-
33
-
34
-
35
-
36
-
37
-
38
-
39
-
40
-
41
-
42
-
43
-
44
-
45
-
46
-
47
-
48
-
49
-
50
-
51
-
52
-
53
-
54
-
55
-
56
-
57
-
58
-
59
-
60
-
61
-
62
-
63
-
64
-
65
-
66
-
67
-
68
-
69
-
70
-
71
-
72
-
73
-
74
-
75
-
76
-
77
-
78
-
79
-
80
-
81
-
82
-
83
-
84
-
85
-
86
-
87
-
88
-
89
-
90
-
91
-
92
-
93
-
94
-
95
-
96
-
97
-
98
-
99
-
100
-
101
-
102
-
103
-
104
-
105
-
106
-
107
-
108
-
109
-
110
-
111
-
112
-
113
-
114
-
115
-
116
-
117
-
118
-
119
-
120
-
121
-
122
-
123
-
124
-
125
-
126
-
127
-
128
-
129
-
130
-
131
-
132
-
133
-
134
-
135
-
136
-
137
-
138
-
139
-
140
-
141
-
142
-
143
-
144
-
145
-
146
-
147
-
148
-
149
-
150
-
151
-
152
-
153
-
154
-
155
-
156
-
157
-
158
-
159
-
160
-
161
-
162
-
163
-
164
-
165
-
166
-
167
-
168
-
169
-
170
-
171
-
172
-
173
-
174
-
175
-
176
-
177
-
178
-
 179
179 -
 180
180 -
 181
181 -
 182
182 -
 183
183 -
 184
184 -
 185
185 -
 186
186 -
 187
187 -
 188
188 -
 189
189 -
 190
190 -
 191
191 -
 192
192 -
 193
193 -
 194
194 -
 195
195 -
 196
196 -
 197
197 -
 198
198 -
 199
199 -
200
-
201
-
202
-
203
-
204
-
205
-
206
-
207
-
208
-
209
-
210
-
211
-
212
-
213
-
214
 |
 |
SLM CORPORATION
NOTES TO CONSOLIDATED FINANCIAL STATEMENTS (Continued)
(Dollars in thousands, except per share amounts, unless otherwise stated)
F-67
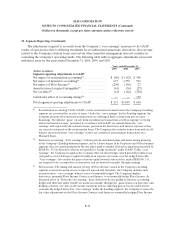
18. Segment Reporting (Continued)
operating segments based on “core earnings.” Accordingly, information regarding the Company’s
reportable segments is provided based on “core earnings.” The Company’s “core earnings” are not defined
terms within GAAP and may not be comparable to similarly titled measures reported by other companies.
“Core earnings” reflect only current period adjustments to GAAP as described below. Unlike financial
accounting, there is no comprehensive, authoritative guidance for management reporting. The
management reporting process measures the performance of the operating segments based on the
management structure of the Company and is not necessarily comparable with similar information for any
other financial institution. The Company’s operating segments are defined by the products and services
they offer or the types of customers they serve, and they reflect the manner in which financial information
is currently evaluated by management. Intersegment revenues and expenses are netted within the
appropriate financial statement line items consistent with the income statement presentation provided to
management. Changes in management structure or allocation methodologies and procedures may result in
changes in reported segment financial information.
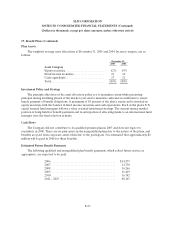
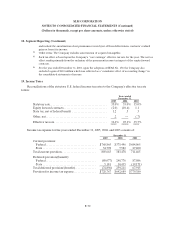
The Company’s principal operations are located in the United States, and its results of operations and
long-lived assets in geographic regions outside of the United States are not significant. In the Lending
segment, no individual customer accounted for more than 10 percent of its total revenue during the years
ended December 31, 2005, 2004 and 2003. USA Funds is the Company’s largest customer in both the
DMO and Corporate and Other segments. During the years ended December 31, 2005, 2004 and 2003,
USA Funds accounted for 36 percent, 44 percent and 44 percent, respectively, of the aggregate revenues
generated by the Company’s DMO and Corporate and Other reportable segments. No other customers
accounted for more than 10 percent of total revenues in those segments for the years mentioned.
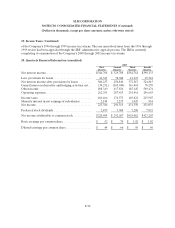
Lending
In the Company’s Lending operating segment, the Company originates and acquires both federally
guaranteed student loans, which are administered by ED in the FFELP, and Private Education Loans,
which are not federally guaranteed. Private Education Loans are primarily used by borrowers to
supplement FFELP loans to meet the rising cost of education. The Company owns and manages student
loans for over nine million borrowers totaling $122 billion at December 31, 2005, of which $106 billion or
87 percent are federally insured. In addition to education lending, the Company also originates mortgage
and consumer loans with the intent of selling the majority of such loans. In 2005, the Company originated
$2 billion in mortgage and consumer loans and its mortgage and consumer loan portfolio totaled
$594 million at December 31, 2005, of which $215 million pertains to mortgages in the held for sale
portfolio.
In addition to its federally insured FFELP products, the Company originates and acquires Private
Education Loans which consist of two general types: (1) those that are designed to bridge the gap between
the cost of higher education and the amount financed through either capped federally insured loans or the
borrowers’ resources, and (2) those that are used to meet the needs of students in alternative learning
programs such as career training, distance learning and lifelong learning programs. Most higher education
Private Education Loans are made in conjunction with a FFELP Stafford loan and as such are marketed
through the same channel as FFELP loans by the same sales force. Unlike FFELP loans, Private
Education Loans are subject to the full credit risk of the borrower. The Company manages this additional