Sallie Mae 2005 Annual Report Download - page 109
Download and view the complete annual report
Please find page 109 of the 2005 Sallie Mae annual report below. You can navigate through the pages in the report by either clicking on the pages listed below, or by using the keyword search tool below to find specific information within the annual report.-
 1
1 -
2
-
3
-
4
-
5
-
6
-
7
-
8
-
9
-
10
-
11
-
12
-
13
-
14
-
15
-
16
-
17
-
18
-
19
-
20
-
21
-
22
-
23
-
24
-
25
-
26
-
27
-
28
-
29
-
30
-
31
-
32
-
33
-
34
-
35
-
36
-
37
-
38
-
39
-
40
-
41
-
42
-
43
-
44
-
45
-
46
-
47
-
48
-
49
-
50
-
51
-
52
-
53
-
54
-
55
-
56
-
57
-
58
-
59
-
60
-
61
-
62
-
63
-
64
-
65
-
66
-
67
-
68
-
69
-
70
-
71
-
72
-
73
-
74
-
75
-
76
-
77
-
78
-
79
-
80
-
81
-
82
-
83
-
84
-
85
-
86
-
87
-
88
-
89
-
90
-
91
-
92
-
93
-
94
-
95
-
96
-
97
-
98
-
 99
99 -
 100
100 -
 101
101 -
 102
102 -
 103
103 -
 104
104 -
 105
105 -
 106
106 -
 107
107 -
 108
108 -
 109
109 -
 110
110 -
 111
111 -
 112
112 -
 113
113 -
 114
114 -
 115
115 -
 116
116 -
 117
117 -
 118
118 -
 119
119 -
120
-
121
-
122
-
123
-
124
-
125
-
126
-
127
-
128
-
129
-
130
-
131
-
132
-
133
-
134
-
135
-
136
-
137
-
138
-
139
-
140
-
141
-
142
-
143
-
144
-
145
-
146
-
147
-
148
-
149
-
150
-
151
-
152
-
153
-
154
-
155
-
156
-
157
-
158
-
159
-
160
-
161
-
162
-
163
-
164
-
165
-
166
-
167
-
168
-
169
-
170
-
171
-
172
-
173
-
174
-
175
-
176
-
177
-
178
-
179
-
180
-
181
-
182
-
183
-
184
-
185
-
186
-
187
-
188
-
189
-
190
-
191
-
192
-
193
-
194
-
195
-
196
-
197
-
198
-
199
-
200
-
201
-
202
-
203
-
204
-
205
-
206
-
207
-
208
-
209
-
210
-
211
-
212
-
213
-
214
 |
 |

99
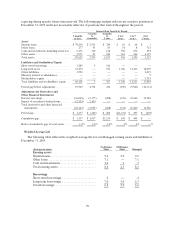
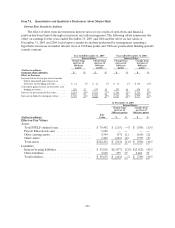
repricing during specific future time intervals. The following gap analysis reflects rate-sensitive positions at
December 31, 2005 and is not necessarily reflective of positions that existed throughout the period.
Interest Rate Sensitivity Period
3 months
or less
3 months
to
6 months
6 months
to
1 year
1 to 2
years
2 to 5
years
Over
5 years
Assets
Student loans.......................... $ 79,230 $ 2,513 $ 784 $ 10 $ 64 $ 3
Other loans........................... 277 43 85 14 8 711
Cash and investments, including restricted . 6,151 110 142 598 672 494
Other assets........................... 1,971 93 186 314 546 4,319
Total assets ........................... 87,629 2,759 1,197 936 1,290 5,527
Liabilities and Stockholders’ Equity
Short-term borrowings .................. 3,289 5 516 — — —
Long-term notes....................... 63,250 — 271 1,326 11,233 12,039
Other liabilities........................ 1,590 — — — — 2,019
Minority interest in subsidiaries .......... — — — — — 9
Stockholders’ equity .................... — — — — — 3,791
Total liabilities and stockholders’ equity . . . 68,129 5 787 1,326 11,233 17,858
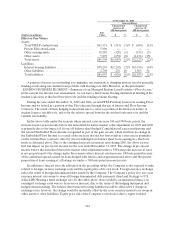
Period gap before adjustments........... 19,500 2,754 410 (390 ) (9,943 ) (12,331)
Adjustments for Derivatives and
Other Financial Instruments
Interest rateswaps..................... (16,040) (5,177) (208) (741 ) 10,240 11,926
Impact of securitized student loans ....... (2,
103) 2,103 — — — —
Total derivatives and other financial
instruments......................... (18,143) (3,074) (208) (741 ) 10,240 11,926
Period gap............................ $ 1,357 $ (320) $ 202 $ (1,131 ) $ 297 $ (405)
Cumulative gap ........................ $ 1,357 $ 1,037 $ 1,239 $ 108 $ 405 $ —
Ratio of cumulative gap to total assets..... 1.4% 1.0% 1.2% .1% .4% —%
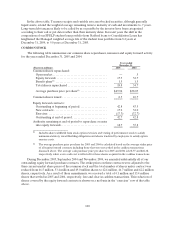
Weighted Average Life
The following table reflects the weighted average life for our Managed earning assets and liabilities at
December 31, 2005.
(Averages in years)
On-Balance
Sheet
Off-Balance
Sheet Managed
Earning assets
Student loans................................. 9.4 5.0 9.0
Other loans .................................. 7.1 — 7.1
Cash and investments ......................... 1.0 .1 .7
Total earningassets........................... 8.6 4.5 8.3
Borrowings
Short-term borrowings......................... .4 — .4
Long-term borrowings ......................... 7.0 5.0 6.3
Total borrowings.............................. 6.8 5.0 6.2