Sallie Mae 2005 Annual Report Download - page 192
Download and view the complete annual report
Please find page 192 of the 2005 Sallie Mae annual report below. You can navigate through the pages in the report by either clicking on the pages listed below, or by using the keyword search tool below to find specific information within the annual report.-
 1
1 -
2
-
3
-
4
-
5
-
6
-
7
-
8
-
9
-
10
-
11
-
12
-
13
-
14
-
15
-
16
-
17
-
18
-
19
-
20
-
21
-
22
-
23
-
24
-
25
-
26
-
27
-
28
-
29
-
30
-
31
-
32
-
33
-
34
-
35
-
36
-
37
-
38
-
39
-
40
-
41
-
42
-
43
-
44
-
45
-
46
-
47
-
48
-
49
-
50
-
51
-
52
-
53
-
54
-
55
-
56
-
57
-
58
-
59
-
60
-
61
-
62
-
63
-
64
-
65
-
66
-
67
-
68
-
69
-
70
-
71
-
72
-
73
-
74
-
75
-
76
-
77
-
78
-
79
-
80
-
81
-
82
-
83
-
84
-
85
-
86
-
87
-
88
-
89
-
90
-
91
-
92
-
93
-
94
-
95
-
96
-
97
-
98
-
99
-
100
-
101
-
102
-
103
-
104
-
105
-
106
-
107
-
108
-
109
-
110
-
111
-
112
-
113
-
114
-
115
-
116
-
117
-
118
-
119
-
120
-
121
-
122
-
123
-
124
-
125
-
126
-
127
-
128
-
129
-
130
-
131
-
132
-
133
-
134
-
135
-
136
-
137
-
138
-
139
-
140
-
141
-
142
-
143
-
144
-
145
-
146
-
147
-
148
-
149
-
150
-
151
-
152
-
153
-
154
-
155
-
156
-
157
-
158
-
159
-
160
-
161
-
162
-
163
-
164
-
165
-
166
-
167
-
168
-
169
-
170
-
171
-
172
-
173
-
174
-
175
-
176
-
177
-
178
-
179
-
180
-
181
-
 182
182 -
 183
183 -
 184
184 -
 185
185 -
 186
186 -
 187
187 -
 188
188 -
 189
189 -
 190
190 -
 191
191 -
 192
192 -
 193
193 -
 194
194 -
 195
195 -
 196
196 -
 197
197 -
 198
198 -
 199
199 -
 200
200 -
 201
201 -
 202
202 -
203
-
204
-
205
-
206
-
207
-
208
-
209
-
210
-
211
-
212
-
213
-
214
 |
 |

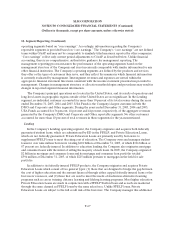
SLM CORPORATION
NOTES TO CONSOLIDATED FINANCIAL STATEMENTS (Continued)
(Dollars in thousands, except per share amounts, unless otherwise stated)
F-70
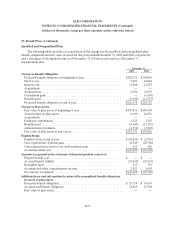
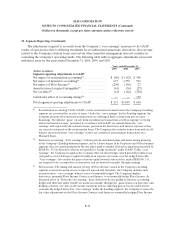
18. Segment Reporting (Continued)
Year ended December 31, 2004
(Dollars in millions) Lending DMO
Corporate
and Other
Segment
Totals Adjustments
Total
GAAP
Interest income:
FFELP Stafford and Other Student Loans. . . $ 1,715 $ — $ — $ 1,715 $ (990 ) $ 725
Consolidation Loans ...................... 1,473 — — 1,473 (108 ) 1,365
Private Education Loans .................. 613 — — 613 (277 ) 336
Other loans.............................. 74 — — 74 — 74
Cash and investments..................... 267 — — 267 (34 ) 233
Total interestincome....................... 4,142 — — 4,142 (1,409 ) 2,733
Total interestexpense....................... 2,320 — — 2,320 (886 ) 1,434
Net interest income......................... 1,822 — — 1,822 (523 ) 1,299
Less: provisionsfor losses ................... 114 — — 114 (3 ) 111
Net interest income after provisions for losses . 1,708 — — 1,708 (520 ) 1,188
Fee income................................ — 300 120 420 — 420
Collections revenue ........................ — 39 — 39 — 39
Other income.............................. 131 — 130 261 1,765 2,026
Loss on GSEdebt and extinguishment........ 221 — — 221 — 221
Operating expenses......................... 409 159 291 859 36 895
Income tax expense (benefit)(1) ............... 430 65 (15) 480 162 642
Minority interest in net earnings of subsidiaries — 1 — 1 — 1
Net income (loss) .......................... $ 779 $114 $(26) $ 867 $ 1,047 $1,914
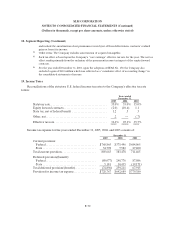
Year Ended December 31, 2003
(Dollars in millions) Lending DMO
Corporate
and Other
Segment
Totals Adjustments
Total
GAAP
Interest income:
FFELP Stafford and Other Student Loans . . $ 1,494 $ — $ — $ 1,494 $ (839 ) $ 655
Consolidation Loans...................... 1,172 — — 1,172 (14 ) 1,158
Private Education Loans.................. 427 — — 427 (120 ) 307
Other loans.............................. 77 — — 77 — 77
Cash and investments..................... 163 — — 163 (12 ) 151
Total interestincome....................... 3,333 — — 3,333 (985 ) 2,348
Total interestexpense....................... 1,681 — — 1,681 (659 ) 1,022
Net interest income......................... 1,652 — — 1,652 (326 ) 1,326
Less: provisionsfor losses ................... 130 — — 130 17 147
Net interest income after provisions for losses . 1,522 — — 1,522 (343 ) 1,179
Fee income................................ — 259 128 387 — 387
Other income.............................. 121 — 123 244 1,168 1,412
Operating expenses......................... 414 123 231 768 27 795
Income tax expense(1) ....................... 407 45 7 459 320 779
Cumulative effect of accounting change ....... — — — — 130 130
Netincome................................ $ 822 $ 91 $ 13 $ 926 $ 608 $1,534
(1) Income taxes are based on a percentage of net income before tax for the individual reportable segment.