Sallie Mae 2005 Annual Report Download - page 91
Download and view the complete annual report
Please find page 91 of the 2005 Sallie Mae annual report below. You can navigate through the pages in the report by either clicking on the pages listed below, or by using the keyword search tool below to find specific information within the annual report.-
 1
1 -
2
-
3
-
4
-
5
-
6
-
7
-
8
-
9
-
10
-
11
-
12
-
13
-
14
-
15
-
16
-
17
-
18
-
19
-
20
-
21
-
22
-
23
-
24
-
25
-
26
-
27
-
28
-
29
-
30
-
31
-
32
-
33
-
34
-
35
-
36
-
37
-
38
-
39
-
40
-
41
-
42
-
43
-
44
-
45
-
46
-
47
-
48
-
49
-
50
-
51
-
52
-
53
-
54
-
55
-
56
-
57
-
58
-
59
-
60
-
61
-
62
-
63
-
64
-
65
-
66
-
67
-
68
-
69
-
70
-
71
-
72
-
73
-
74
-
75
-
76
-
77
-
78
-
79
-
80
-
 81
81 -
 82
82 -
 83
83 -
 84
84 -
 85
85 -
 86
86 -
 87
87 -
 88
88 -
 89
89 -
 90
90 -
 91
91 -
 92
92 -
 93
93 -
 94
94 -
 95
95 -
 96
96 -
 97
97 -
 98
98 -
 99
99 -
 100
100 -
 101
101 -
102
-
103
-
104
-
105
-
106
-
107
-
108
-
109
-
110
-
111
-
112
-
113
-
114
-
115
-
116
-
117
-
118
-
119
-
120
-
121
-
122
-
123
-
124
-
125
-
126
-
127
-
128
-
129
-
130
-
131
-
132
-
133
-
134
-
135
-
136
-
137
-
138
-
139
-
140
-
141
-
142
-
143
-
144
-
145
-
146
-
147
-
148
-
149
-
150
-
151
-
152
-
153
-
154
-
155
-
156
-
157
-
158
-
159
-
160
-
161
-
162
-
163
-
164
-
165
-
166
-
167
-
168
-
169
-
170
-
171
-
172
-
173
-
174
-
175
-
176
-
177
-
178
-
179
-
180
-
181
-
182
-
183
-
184
-
185
-
186
-
187
-
188
-
189
-
190
-
191
-
192
-
193
-
194
-
195
-
196
-
197
-
198
-
199
-
200
-
201
-
202
-
203
-
204
-
205
-
206
-
207
-
208
-
209
-
210
-
211
-
212
-
213
-
214
 |
 |

81
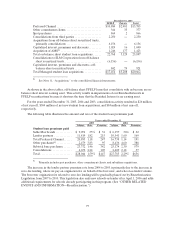
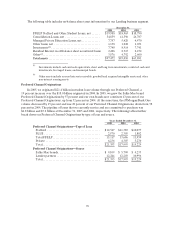
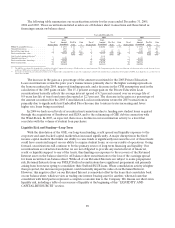
Purchased Paper—Non-Mortgage
Years ended
December 31,
2005 2004(1)
Face value ofpurchases.................................... $2,830 $426
Purchase price............................................ 198 19
% of face value purchased ................................. 7.0% 4.5%
Gross Cash Collections (“GCC”) ........................... $ 250 $ 59
Collections revenue ....................................... 157 39
% of GCC ............................................... 63% 66%
Carrying value of purchases................................ $ 158 $ 52
(1) AFS was purchased in September 2004. Prior to this acquisition, the Company was not in the
purchased paper business.
The amount of face value of purchases in any quarter is a function of a combination of factors
including the amount of receivables available for purchase in the marketplace, average age of each
portfolio, the asset class of the receivables, and competition in the marketplace. As a result, the percentage
of principal purchased will vary from quarter to quarter. The decrease in purchase paper revenue as a
percentage of GCC can primarily be attributed to the increase in new portfolio purchases in the second
half of 2005. Typically, revenue recognition based on a portfolio’s effective interest rate is a lower
percentage of cash collections in the early stages of servicing a portfolio.
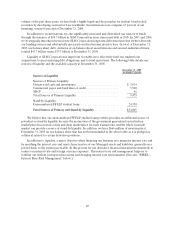
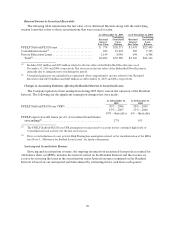
Purchased Paper—Mortgage/Properties
Year ended
December 31, 2005(1)
Face value ofpurchases..................................... $165
Collections revenue ........................................ 10
Collateral value of purchases................................ 232
Purchase price............................................. 141
% of collateral value ....................................... 61%
Carrying value of purchases................................. $298
(1) GRP was purchased in August 2005. Prior to this acquisition, the Company was not in the mortgage
purchased paper business.
The purchase price for sub-performing and non-performing mortgage loans is generally determined as
a percentage of the underlying collateral. Fluctuations in the purchase price as a percentage of collateral
value can be caused by a number of factors including the percentage of second mortgages in the portfolio
and the level of private mortgage insurance associated with particular assets.