Sallie Mae 2005 Annual Report Download - page 141
Download and view the complete annual report
Please find page 141 of the 2005 Sallie Mae annual report below. You can navigate through the pages in the report by either clicking on the pages listed below, or by using the keyword search tool below to find specific information within the annual report.-
 1
1 -
2
-
3
-
4
-
5
-
6
-
7
-
8
-
9
-
10
-
11
-
12
-
13
-
14
-
15
-
16
-
17
-
18
-
19
-
20
-
21
-
22
-
23
-
24
-
25
-
26
-
27
-
28
-
29
-
30
-
31
-
32
-
33
-
34
-
35
-
36
-
37
-
38
-
39
-
40
-
41
-
42
-
43
-
44
-
45
-
46
-
47
-
48
-
49
-
50
-
51
-
52
-
53
-
54
-
55
-
56
-
57
-
58
-
59
-
60
-
61
-
62
-
63
-
64
-
65
-
66
-
67
-
68
-
69
-
70
-
71
-
72
-
73
-
74
-
75
-
76
-
77
-
78
-
79
-
80
-
81
-
82
-
83
-
84
-
85
-
86
-
87
-
88
-
89
-
90
-
91
-
92
-
93
-
94
-
95
-
96
-
97
-
98
-
99
-
100
-
101
-
102
-
103
-
104
-
105
-
106
-
107
-
108
-
109
-
110
-
111
-
112
-
113
-
114
-
115
-
116
-
117
-
118
-
119
-
120
-
121
-
122
-
123
-
124
-
125
-
126
-
127
-
128
-
129
-
130
-
 131
131 -
 132
132 -
 133
133 -
 134
134 -
 135
135 -
 136
136 -
 137
137 -
 138
138 -
 139
139 -
 140
140 -
 141
141 -
 142
142 -
 143
143 -
 144
144 -
 145
145 -
 146
146 -
 147
147 -
 148
148 -
 149
149 -
 150
150 -
 151
151 -
152
-
153
-
154
-
155
-
156
-
157
-
158
-
159
-
160
-
161
-
162
-
163
-
164
-
165
-
166
-
167
-
168
-
169
-
170
-
171
-
172
-
173
-
174
-
175
-
176
-
177
-
178
-
179
-
180
-
181
-
182
-
183
-
184
-
185
-
186
-
187
-
188
-
189
-
190
-
191
-
192
-
193
-
194
-
195
-
196
-
197
-
198
-
199
-
200
-
201
-
202
-
203
-
204
-
205
-
206
-
207
-
208
-
209
-
210
-
211
-
212
-
213
-
214
 |
 |

SLM CORPORATION
NOTES TO CONSOLIDATED FINANCIAL STATEMENTS (Continued)
(Dollars in thousands, except per share amounts, unless otherwise stated)
F-19
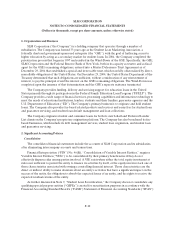
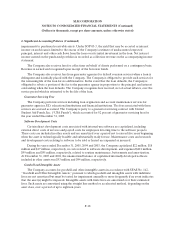
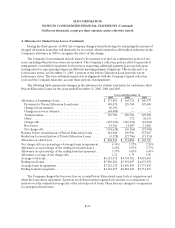
2. Significant Accounting Policies (Continued)
Accounting for Stock-Based Compensation
The Company has stock-based employee compensation plans and plans for non-employee members of
its Board of Directors, which are described more fully in Note 16, “Stock-Based Compensation Plans.” As
of December 31, 2005, the Company accounted for its stock options using the intrinsic value method of
accounting as prescribed by Accounting Principles Board (“APB”) Opinion No. 25, “Accounting for Stock
Issued to Employees.” Under APB No. 25, the Company does not recognize compensation expense on
fixed award plans unless the exercise price of its employee stock options is less than the market price of the
underlying stock on the date of grant. The Company grants all of its options at the fair market value of the
underlying stock on the date of grant. Consequently, the Company has not recorded such expense in the
periods presented.
The fair values for the options granted in the years ended December 31, 2005, 2004 and 2003 were
estimated at the date of grant using a Black-Scholes option pricing model, with the following weighted
average assumptions:
Years Ended December 31,
2005 2004 2003
Riskfree interest rate............................................. 3.87% 2.59% 2.47%
Expectedvolatility................................................ 21.48% 16.27% 25.31%
Expected dividend rate............................................ 1.58% 1.66% 1.28%
Expected lifeof the option(in years) ............................... 3 years 3 years 3 years
The following table summarizes pro forma disclosures for the years ended December 31, 2005, 2004
and 2003, as if the Company had accounted for employee and Board of Directors stock options granted
subsequent to December 31, 1994 under the fair market value method as set forth in SFAS No. 123, as
amended by SFAS No. 148, “Accounting for Stock-Based Compensation.” The option value is amortized
over an assumed vesting period of between one to three years or to the actual date of vesting, whichever
comes first.
Years Ended December 31,
2005 2004 2003
Net income attributable to common stock ...................... $1,360,381 $1,901,769 $1,522,059
Less: Total stock-based employee compensation expense
determined under fair value based method for all awards,
net of related tax effects.................................... (39,499) (41,885) (85,503)
Pro formanet income attributable to commonstock............. $1,320,882 $1,859,884 $1,436,556
Basic earnings per common share, after cumulative effect of
accounting change......................................... $ 3.25 $ 4.36 $ 3.37
Pro forma basic earnings per common share, after cumulative
effect of accounting change................................. $ 3.16 $ 4.26 $ 3.18
Diluted earnings per common share, after cumulative effect of
accountingchange......................................... $ 3.05 $ 4.04 $ 3.18
Pro forma diluted earnings per common share, after cumulative
effect of accounting change................................. $ 2.97 $ 3.96 $ 3.00