Sallie Mae 2005 Annual Report Download - page 56
Download and view the complete annual report
Please find page 56 of the 2005 Sallie Mae annual report below. You can navigate through the pages in the report by either clicking on the pages listed below, or by using the keyword search tool below to find specific information within the annual report.-
 1
1 -
2
-
3
-
4
-
5
-
6
-
7
-
8
-
9
-
10
-
11
-
12
-
13
-
14
-
15
-
16
-
17
-
18
-
19
-
20
-
21
-
22
-
23
-
24
-
25
-
26
-
27
-
28
-
29
-
30
-
31
-
32
-
33
-
34
-
35
-
36
-
37
-
38
-
39
-
40
-
41
-
42
-
43
-
44
-
45
-
 46
46 -
 47
47 -
 48
48 -
 49
49 -
 50
50 -
 51
51 -
 52
52 -
 53
53 -
 54
54 -
 55
55 -
 56
56 -
 57
57 -
 58
58 -
 59
59 -
 60
60 -
 61
61 -
 62
62 -
 63
63 -
 64
64 -
 65
65 -
 66
66 -
67
-
68
-
69
-
70
-
71
-
72
-
73
-
74
-
75
-
76
-
77
-
78
-
79
-
80
-
81
-
82
-
83
-
84
-
85
-
86
-
87
-
88
-
89
-
90
-
91
-
92
-
93
-
94
-
95
-
96
-
97
-
98
-
99
-
100
-
101
-
102
-
103
-
104
-
105
-
106
-
107
-
108
-
109
-
110
-
111
-
112
-
113
-
114
-
115
-
116
-
117
-
118
-
119
-
120
-
121
-
122
-
123
-
124
-
125
-
126
-
127
-
128
-
129
-
130
-
131
-
132
-
133
-
134
-
135
-
136
-
137
-
138
-
139
-
140
-
141
-
142
-
143
-
144
-
145
-
146
-
147
-
148
-
149
-
150
-
151
-
152
-
153
-
154
-
155
-
156
-
157
-
158
-
159
-
160
-
161
-
162
-
163
-
164
-
165
-
166
-
167
-
168
-
169
-
170
-
171
-
172
-
173
-
174
-
175
-
176
-
177
-
178
-
179
-
180
-
181
-
182
-
183
-
184
-
185
-
186
-
187
-
188
-
189
-
190
-
191
-
192
-
193
-
194
-
195
-
196
-
197
-
198
-
199
-
200
-
201
-
202
-
203
-
204
-
205
-
206
-
207
-
208
-
209
-
210
-
211
-
212
-
213
-
214
 |
 |
46
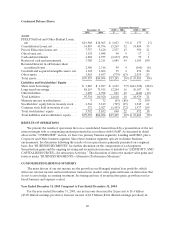
we lowered our estimate of the number of Stafford borrowers who will eventually qualify for Borrower
Benefits and revised the term over which benefits are expected to be realized. As a result, we recorded a
$5 million reduction in the liability for Borrower Benefits. The net effect of these updates to our estimates
in 2004 was $3 million.
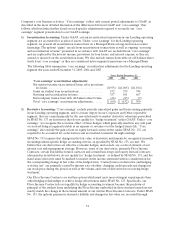
Discussion of Student Loan Spread—Effects of Significant Events in 2005 and 2004
There was a record level of Consolidation Loan activity in the second quarter of 2005 caused primarily
by FFELP Stafford borrowers locking in lower interest rates by consolidating their loans prior to the July 1
interest rate reset for FFELP Stafford loans. In addition, borrowers were permitted for the first time to
consolidate their loans while still in school. This unprecedented volume of Consolidation Loan requests
resulted in a majority of the applications being processed in the third and fourth quarters. The increase to
premium amortization in 2005 can mainly be attributed to this surge in Consolidation Loan activity as we
write-off the balance of unamortized premiums associated with loans that consolidate away from the
Company as a current period expense in accordance with SFAS No. 91 (as discussed under “RESULTS
OF OPERATIONS—NET INTEREST INCOME—Student Loans”).
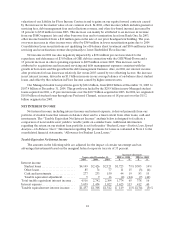
In the fourth quarter of 2005, in addition to the Consolidation Loan activity discussed above, a
significant volume of our Consolidation Loans were consolidated with third party lenders through the
Direct Lending program (see “LENDING BUSINESS SEGMENT—Consolidation Loan Activity” for
further discussion). As discussed above, this also resulted in an increase in student loan premium write-offs
for loans consolidated with third parties. Conversely, loans lost through consolidation benefit the student
loan spread through the write-off of Borrower Benefits reserves associated with these loans.
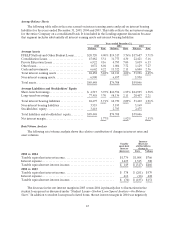
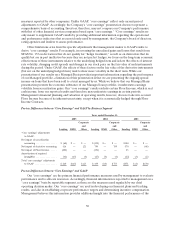
Discussion of Student Loan Spread—Other Year-over-Year Fluctuations
The decrease in the 2005 student loan spread versus the prior year is primarily due to the decrease in
gross Floor Income discussed above. Additionally, higher average balance of Consolidation Loans as a
percentage of the on-balance sheet portfolio contributes to downward pressure on the spread.
Consolidation Loans have lower spreads than other FFELP loans due to the 105 basis point Consolidation
Loan Rebate Fee, more robust Borrower Benefits, and higher funding costs due to their longer terms.
These negative effects are partially offset by lower student loan premium amortization due to the extended
term and a higher Special Allowance Payment (“SAP”) yield. The average balance of Consolidation Loans
grew as a percentage of the average on-balance sheet FFELP student loan portfolio from 62 percent in
2004 to 69 percent in 2005.
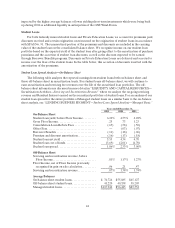
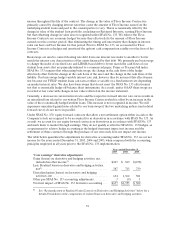
Other factors that impacted the student loan spread include higher spreads on our debt funding
student loans as a result of the GSE Wind-Down, partially offset by lower Borrower Benefits costs, and the
absence of Offset Fees on GSE financed loans. The increase in funding costs is due to the replacement of
lower cost, primarily short-term GSE funding with longer term, higher cost funding. The decrease in
Borrower Benefits costs can be attributed primarily to the write-off of Borrower Benefits reserves due to
the significant volume of Consolidation Loan activity as discussed above. The negative effects on the
spread were partially offset by the 43 percent increase in Private Education Loans in the on-balance sheet
student loan portfolio.
In addition to the effects of estimate adjustments, the student loan spread decreased by 74 basis points
from 2003 to 2004. This decrease was primarily due to the higher average balance of Consolidation Loans,
lower Floor Income and higher funding spreads on the debt. These negative effects were partially offset by
the increase in Private Education Loans in the on-balance sheet student loan portfolio.