Sallie Mae 2005 Annual Report Download - page 90
Download and view the complete annual report
Please find page 90 of the 2005 Sallie Mae annual report below. You can navigate through the pages in the report by either clicking on the pages listed below, or by using the keyword search tool below to find specific information within the annual report.-
 1
1 -
2
-
3
-
4
-
5
-
6
-
7
-
8
-
9
-
10
-
11
-
12
-
13
-
14
-
15
-
16
-
17
-
18
-
19
-
20
-
21
-
22
-
23
-
24
-
25
-
26
-
27
-
28
-
29
-
30
-
31
-
32
-
33
-
34
-
35
-
36
-
37
-
38
-
39
-
40
-
41
-
42
-
43
-
44
-
45
-
46
-
47
-
48
-
49
-
50
-
51
-
52
-
53
-
54
-
55
-
56
-
57
-
58
-
59
-
60
-
61
-
62
-
63
-
64
-
65
-
66
-
67
-
68
-
69
-
70
-
71
-
72
-
73
-
74
-
75
-
76
-
77
-
78
-
79
-
 80
80 -
 81
81 -
 82
82 -
 83
83 -
 84
84 -
 85
85 -
 86
86 -
 87
87 -
 88
88 -
 89
89 -
 90
90 -
 91
91 -
 92
92 -
 93
93 -
 94
94 -
 95
95 -
 96
96 -
 97
97 -
 98
98 -
 99
99 -
 100
100 -
101
-
102
-
103
-
104
-
105
-
106
-
107
-
108
-
109
-
110
-
111
-
112
-
113
-
114
-
115
-
116
-
117
-
118
-
119
-
120
-
121
-
122
-
123
-
124
-
125
-
126
-
127
-
128
-
129
-
130
-
131
-
132
-
133
-
134
-
135
-
136
-
137
-
138
-
139
-
140
-
141
-
142
-
143
-
144
-
145
-
146
-
147
-
148
-
149
-
150
-
151
-
152
-
153
-
154
-
155
-
156
-
157
-
158
-
159
-
160
-
161
-
162
-
163
-
164
-
165
-
166
-
167
-
168
-
169
-
170
-
171
-
172
-
173
-
174
-
175
-
176
-
177
-
178
-
179
-
180
-
181
-
182
-
183
-
184
-
185
-
186
-
187
-
188
-
189
-
190
-
191
-
192
-
193
-
194
-
195
-
196
-
197
-
198
-
199
-
200
-
201
-
202
-
203
-
204
-
205
-
206
-
207
-
208
-
209
-
210
-
211
-
212
-
213
-
214
 |
 |

80
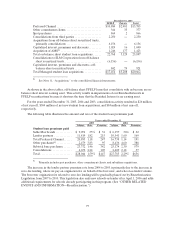
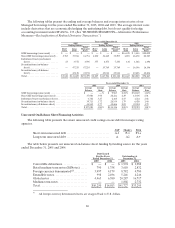
Revenues from USA Funds represented 34 percent, 56 percent, and 66 percent, respectively, of total
DMO revenue in 2005, 2004, and 2003. The percentage of revenue generated from services provided to
USA Funds should continue to decrease due to the impact of recent acquisitions and the continued
diversification into new asset classes in both the purchased paper and contingency collection businesses.
DMO Revenue by Product
Years ended December 31,
2005(2) 2004(3) 2003
Purchased paper collections revenue ................ $167 $ 39 $ —
Contingency:
Studentloans................................... 258 253 217
Other ......................................... 55 18 10
Totalcontingency................................. 313 271 227
Other ........................................... 47 29 32
Total............................................ $527 $339 $259
USA Funds(1) .................................... $ 180 $ 190 $171
% of total DMO revenue .......................... 34% 56% 66 %
(1) United Student Aid Funds, Inc. (“USA Funds”).
(2) Includes revenue attributed to GRP for the period from August 31 to December 31.
(3) Includes revenue attributed to AFS for the period from September 16 to December 31.
Fee Income and Collections Revenue
On August 31, 2005, we acquired 100 percent of GRP, a debt management company that acquires and
manages portfolios of sub-performing and non-performing mortgage loans, substantially all of which are
secured by one-to-four family residential real estate. On December 22, 2005, we acquired an additional
12 percent ownership stake in AFS, increasing our ownership to 76 percent.
The $188 million increase in DMO revenue for the year ended December 31, 2005 over 2004 can be
primarily attributed to the year-over-year growth in the purchased paper businesses of AFS (acquired in
September 2004) and to revenue generated by GRP. Contingency fee revenue increased by $42 million, or
15 percent, to $313 million for the year ended December 31, 2005 versus the year-ago period. The year-
over-year growth in contingency fee revenue was primarily driven by the addition of fees earned from state
tax collections and by the growth in contingent fee revenues from non-student loan asset classes.
The rapid growth in Consolidation Loan activity has had a negative impact on our student loan
contingency collection business. When a borrower consolidates a FFELP Stafford loan, the borrower is
effectively refinancing his or her Stafford loan to a longer term at a fixed interest rate, which significantly
reduces the borrower’s monthly payment. The overall effect of the record Consolidation Loan activity is
lower industry-wide student loan defaults and lower contingency collection inventory. The recently passed
HEA reduces fees paid for collections via loan consolidation and also puts a cap on collections for loan
consolidations. These fee reductions will also negatively impact student loan contingency fees going
forward.