PNC Bank 2014 Annual Report Download - page 99
Download and view the complete annual report
Please find page 99 of the 2014 PNC Bank annual report below. You can navigate through the pages in the report by either clicking on the pages listed below, or by using the keyword search tool below to find specific information within the annual report.-
 1
1 -
2
-
3
-
4
-
5
-
6
-
7
-
8
-
9
-
10
-
11
-
12
-
13
-
14
-
15
-
16
-
17
-
18
-
19
-
20
-
21
-
22
-
23
-
24
-
25
-
26
-
27
-
28
-
29
-
30
-
31
-
32
-
33
-
34
-
35
-
36
-
37
-
38
-
39
-
40
-
41
-
42
-
43
-
44
-
45
-
46
-
47
-
48
-
49
-
50
-
51
-
52
-
53
-
54
-
55
-
56
-
57
-
58
-
59
-
60
-
61
-
62
-
63
-
64
-
65
-
66
-
67
-
68
-
69
-
70
-
71
-
72
-
73
-
74
-
75
-
76
-
77
-
78
-
79
-
80
-
81
-
82
-
83
-
84
-
85
-
86
-
87
-
88
-
 89
89 -
 90
90 -
 91
91 -
 92
92 -
 93
93 -
 94
94 -
 95
95 -
 96
96 -
 97
97 -
 98
98 -
 99
99 -
 100
100 -
 101
101 -
 102
102 -
 103
103 -
 104
104 -
 105
105 -
 106
106 -
 107
107 -
 108
108 -
 109
109 -
110
-
111
-
112
-
113
-
114
-
115
-
116
-
117
-
118
-
119
-
120
-
121
-
122
-
123
-
124
-
125
-
126
-
127
-
128
-
129
-
130
-
131
-
132
-
133
-
134
-
135
-
136
-
137
-
138
-
139
-
140
-
141
-
142
-
143
-
144
-
145
-
146
-
147
-
148
-
149
-
150
-
151
-
152
-
153
-
154
-
155
-
156
-
157
-
158
-
159
-
160
-
161
-
162
-
163
-
164
-
165
-
166
-
167
-
168
-
169
-
170
-
171
-
172
-
173
-
174
-
175
-
176
-
177
-
178
-
179
-
180
-
181
-
182
-
183
-
184
-
185
-
186
-
187
-
188
-
189
-
190
-
191
-
192
-
193
-
194
-
195
-
196
-
197
-
198
-
199
-
200
-
201
-
202
-
203
-
204
-
205
-
206
-
207
-
208
-
209
-
210
-
211
-
212
-
213
-
214
-
215
-
216
-
217
-
218
-
219
-
220
-
221
-
222
-
223
-
224
-
225
-
226
-
227
-
228
-
229
-
230
-
231
-
232
-
233
-
234
-
235
-
236
-
237
-
238
-
239
-
240
-
241
-
242
-
243
-
244
-
245
-
246
-
247
-
248
-
249
-
250
-
251
-
252
-
253
-
254
-
255
-
256
-
257
-
258
-
259
-
260
-
261
-
262
-
263
-
264
-
265
-
266
-
267
-
268
 |
 |
• Timing of available information, including the
performance of first lien positions, and
• Limitations of available historical data.
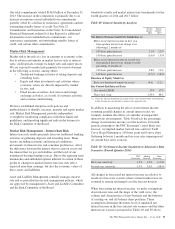
PNC’s determination of the ALLL for non-impaired loans is
sensitive to the risk grades assigned to commercial loans and
loss rates for consumer loans. There are several other qualitative
and quantitative factors considered in determining the ALLL.
This sensitivity analysis does not necessarily reflect the nature
and extent of future changes in the ALLL. It is intended to
provide insight into the impact of adverse changes to risk grades
and loss rates only and does not imply any expectation of future
deterioration in the risk ratings or loss rates. Given the current
processes used, we believe the risk grades and loss rates
currently assigned are appropriate. In the hypothetical event that
the aggregate weighted average commercial loan risk grades
would experience a 1% deterioration, assuming all other
variables remain constant, the allowance for commercial loans
would increase by approximately $35 million as of December
31, 2014. In the hypothetical event that consumer loss rates
would increase by 10%, assuming all other variables remain
constant, the allowance for consumer loans would increase by
approximately $37 million at December 31, 2014.
Purchased impaired loans are initially recorded at fair value
and applicable accounting guidance prohibits the carry over or
creation of valuation allowances at acquisition. Because the
initial fair values of these loans already reflect a credit
component, additional reserves are established when
performance is expected to be worse than our expectations as
of the acquisition date. At December 31, 2014, we had
established reserves of $.9 billion for purchased impaired
loans. In addition, loans (purchased impaired and non-
impaired) acquired after January 1, 2009 were recorded at fair
value.No allowance for loan losses was carried over and no
allowance was created at the date of acquisition. See Note 4
Purchased Loans in the Notes To Consolidated Financial
Statements in Item 8 of this Report for additional information.
In determining the appropriateness of the ALLL, we make
specific allocations to impaired loans and allocations to
portfolios of commercial and consumer loans. We also
allocate reserves to provide coverage for probable losses
incurred in the portfolio at the balance sheet date based upon
current market conditions, which may not be reflected in
historical loss data. Commercial lending is the largest category
of credits and is sensitive to changes in assumptions and
judgments underlying the determination of the ALLL. We
have allocated approximately $1.6 billion, or 47%, of the
ALLL at December 31, 2014 to the commercial lending
category. Consumer lending allocations are made based on
historical loss experience adjusted for recent activity.
Approximately $1.7 billion, or 53%, of the ALLL at
December 31, 2014 has been allocated to these consumer
lending categories.
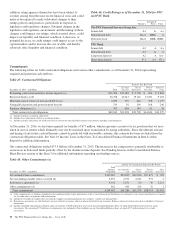
In addition to the ALLL, we maintain an allowance for
unfunded loan commitments and letters of credit. We report
this allowance as a liability on our Consolidated Balance
Sheet. We maintain the allowance for unfunded loan
commitments and letters of credit at a level we believe is
appropriate to absorb estimated probable losses on these
unfunded credit facilities. We determine this amount using
estimates of the probability of the ultimate funding and losses
related to those credit exposures. Other than the estimation of
the probability of funding, this methodology is very similar to
the one we use for determining our ALLL.
We refer you to Note 1 Accounting Policies and Note 3 Asset
Quality in the Notes To Consolidated Financial Statements in
Item 8 of this Report for further information on certain key
asset quality indicators that we use to evaluate our portfolios
and establish the allowances.
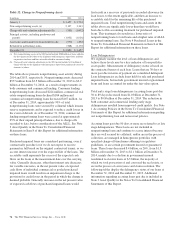
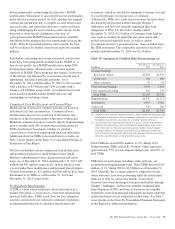
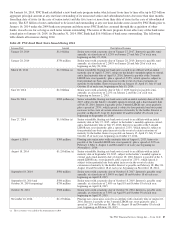
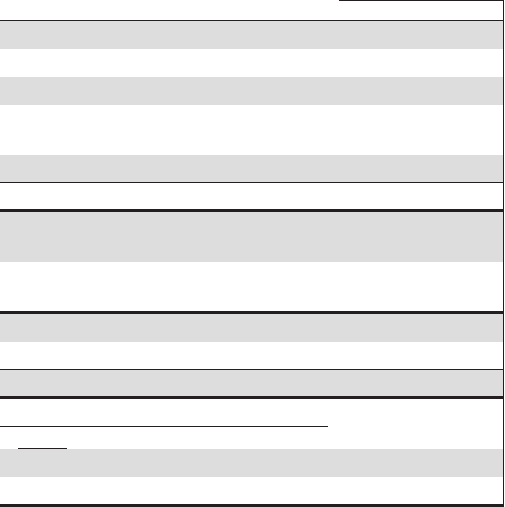
Table 41: Allowance for Loan and Lease Losses
Dollars in millions 2014 2013
January 1 $3,609 $ 4,036
Total net charge-offs (a) (531) (1,077)
Provision for credit losses 273 643
Net change in allowance for unfunded loan
commitments and letters of credit (17) 8
Other (3) (1)
December 31 $3,331 $ 3,609
Net charge-offs to average loans (for the year
ended) (a) .27% .57%
Allowance for loan and lease losses to total
loans 1.63 1.84
Commercial lending net charge-offs $ (55) $ (249)
Consumer lending net charge-offs (a) (476) (828)
Total net charge-offs $ (531) $(1,077)
Net charge-offs to average loans (for the year
ended)
Commercial lending .04% .22%
Consumer lending (a) 0.62 1.07
(a) Includes charge-offs of $134 million taken pursuant to alignment with interagency
guidance on practices for loans and lines of credit related to consumer lending in the
first quarter of 2013.
The provision for credit losses totaled $273 million for 2014
compared to $643 million for 2013. The primary drivers of the
decrease to the provision were improved overall credit quality,
including lower consumer loan delinquencies, and the
increasing value of residential real estate which resulted in
greater expected cash flows from our purchased impaired
loans. For 2014, the provision for commercial lending credit
losses increased by $64 million, or 178%, from 2013 primarily
due to continued growth in the commercial book, paired with
slowing of the reserve releases related to credit quality
improvement. The provision for consumer lending credit
losses decreased $434 million, or 71%, from 2013.
The PNC Financial Services Group, Inc. – Form 10-K 81