PNC Bank 2014 Annual Report Download - page 63
Download and view the complete annual report
Please find page 63 of the 2014 PNC Bank annual report below. You can navigate through the pages in the report by either clicking on the pages listed below, or by using the keyword search tool below to find specific information within the annual report.-
 1
1 -
2
-
3
-
4
-
5
-
6
-
7
-
8
-
9
-
10
-
11
-
12
-
13
-
14
-
15
-
16
-
17
-
18
-
19
-
20
-
21
-
22
-
23
-
24
-
25
-
26
-
27
-
28
-
29
-
30
-
31
-
32
-
33
-
34
-
35
-
36
-
37
-
38
-
39
-
40
-
41
-
42
-
43
-
44
-
45
-
46
-
47
-
48
-
49
-
50
-
51
-
52
-
 53
53 -
 54
54 -
 55
55 -
 56
56 -
 57
57 -
 58
58 -
 59
59 -
 60
60 -
 61
61 -
 62
62 -
 63
63 -
 64
64 -
 65
65 -
 66
66 -
 67
67 -
 68
68 -
 69
69 -
 70
70 -
 71
71 -
 72
72 -
 73
73 -
74
-
75
-
76
-
77
-
78
-
79
-
80
-
81
-
82
-
83
-
84
-
85
-
86
-
87
-
88
-
89
-
90
-
91
-
92
-
93
-
94
-
95
-
96
-
97
-
98
-
99
-
100
-
101
-
102
-
103
-
104
-
105
-
106
-
107
-
108
-
109
-
110
-
111
-
112
-
113
-
114
-
115
-
116
-
117
-
118
-
119
-
120
-
121
-
122
-
123
-
124
-
125
-
126
-
127
-
128
-
129
-
130
-
131
-
132
-
133
-
134
-
135
-
136
-
137
-
138
-
139
-
140
-
141
-
142
-
143
-
144
-
145
-
146
-
147
-
148
-
149
-
150
-
151
-
152
-
153
-
154
-
155
-
156
-
157
-
158
-
159
-
160
-
161
-
162
-
163
-
164
-
165
-
166
-
167
-
168
-
169
-
170
-
171
-
172
-
173
-
174
-
175
-
176
-
177
-
178
-
179
-
180
-
181
-
182
-
183
-
184
-
185
-
186
-
187
-
188
-
189
-
190
-
191
-
192
-
193
-
194
-
195
-
196
-
197
-
198
-
199
-
200
-
201
-
202
-
203
-
204
-
205
-
206
-
207
-
208
-
209
-
210
-
211
-
212
-
213
-
214
-
215
-
216
-
217
-
218
-
219
-
220
-
221
-
222
-
223
-
224
-
225
-
226
-
227
-
228
-
229
-
230
-
231
-
232
-
233
-
234
-
235
-
236
-
237
-
238
-
239
-
240
-
241
-
242
-
243
-
244
-
245
-
246
-
247
-
248
-
249
-
250
-
251
-
252
-
253
-
254
-
255
-
256
-
257
-
258
-
259
-
260
-
261
-
262
-
263
-
264
-
265
-
266
-
267
-
268
 |
 |

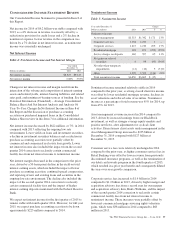
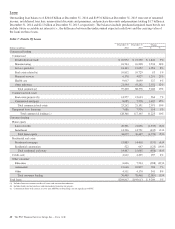
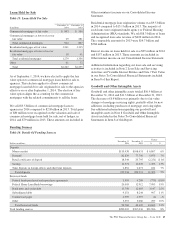
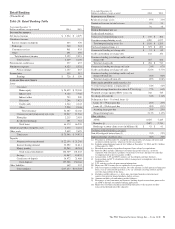
Loans Held for Sale
Table 15: Loans Held For Sale
In millions
December 31
2014
December 31
2013
Commercial mortgages at fair value $ 893 $ 586
Commercial mortgages at lower of cost or
fair value 29 281
Total commercial mortgages 922 867
Residential mortgages at fair value 1,261 1,315
Residential mortgages at lower of cost or
fair value 18 41
Total residential mortgages 1,279 1,356
Other 61 32
Total $2,262 $2,255
As of September 1, 2014, we have elected to apply the fair
value option to commercial mortgage loans held for sale to
agencies. This election applies to all new commercial
mortgage loans held for sale originated for sale to the agencies
effective on or after September 1, 2014. The election of fair
value option aligns the accounting for the commercial
mortgages with the related commitments to sell the loans.
We sold $3.5 billion of commercial mortgage loans to
agencies in 2014 compared to $2.8 billion in 2013. Total gains
of $80 million were recognized on the valuation and sale of
commercial mortgage loans held for sale, net of hedges, in
2014, and $79 million in 2013. These amounts are included in
Other noninterest income on our Consolidated Income
Statement.
Residential mortgage loan origination volume was $9.5 billion
in 2014 compared to $15.1 billion in 2013. The majority of
such loans were originated under agency or Federal Housing
Administration (FHA) standards. We sold $8.3 billion of loans
and recognized loan sales revenue of $420 million in 2014.
The comparable amounts for 2013 were $14.7 billion and
$568 million.
Interest income on loans held for sale was $99 million in 2014
and $157 million in 2013. These amounts are included in
Other interest income on our Consolidated Income Statement.
Additional information regarding our loan sale and servicing
activities is included in Note 2 Loan Sale and Servicing
Activities and Variable Interest Entities and Note 7 Fair Value
in our Notes To Consolidated Financial Statements included
in Item 8 of this Report.
Goodwill and Other Intangible Assets
Goodwill and other intangible assets totaled $10.9 billion at
December 31, 2014 and $11.3 billion at December 31, 2013.
The decrease of $.4 billion was primarily due to fair value
changes of mortgage servicing rights, partially offset by new
additions, including purchases of mortgage servicing rights.
See additional information regarding our goodwill and
intangible assets in Note 8 Goodwill and Other Intangible
Assets included in the Notes To Consolidated Financial
Statements in Item 8 of this Report.
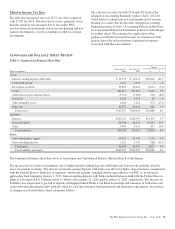
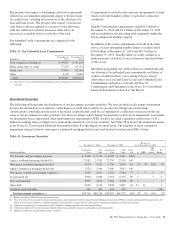
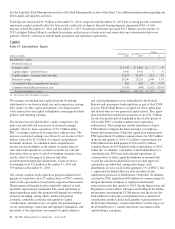
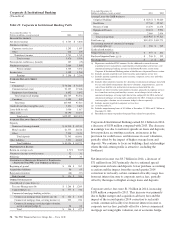
Funding Sources
Table 16: Details Of Funding Sources
Dollars in millions
December 31
2014
December 31
2013
Change
$%
Deposits
Money market $115,438 $108,631 $ 6,807 6%
Demand 82,829 77,756 5,073 7%
Retail certificates of deposit 18,544 20,795 (2,251) (11)%
Savings 12,571 11,078 1,493 13%
Time deposits in foreign offices and other time deposits 2,852 2,671 181 7%
Total deposits 232,234 220,931 11,303 5%
Borrowed funds
Federal funds purchased and repurchase agreements 3,510 4,289 (779) (18)%
Federal Home Loan Bank borrowings 20,005 12,912 7,093 55%
Bank notes and senior debt 15,750 12,603 3,147 25%
Subordinated debt 9,151 8,244 907 11%
Commercial paper 4,995 4,997 (2) –%
Other 3,357 3,060 297 10%
Total borrowed funds 56,768 46,105 10,663 23%
Total funding sources $289,002 $267,036 $21,966 8%
The PNC Financial Services Group, Inc. – Form 10-K 45