PNC Bank 2014 Annual Report Download - page 93
Download and view the complete annual report
Please find page 93 of the 2014 PNC Bank annual report below. You can navigate through the pages in the report by either clicking on the pages listed below, or by using the keyword search tool below to find specific information within the annual report.-
 1
1 -
2
-
3
-
4
-
5
-
6
-
7
-
8
-
9
-
10
-
11
-
12
-
13
-
14
-
15
-
16
-
17
-
18
-
19
-
20
-
21
-
22
-
23
-
24
-
25
-
26
-
27
-
28
-
29
-
30
-
31
-
32
-
33
-
34
-
35
-
36
-
37
-
38
-
39
-
40
-
41
-
42
-
43
-
44
-
45
-
46
-
47
-
48
-
49
-
50
-
51
-
52
-
53
-
54
-
55
-
56
-
57
-
58
-
59
-
60
-
61
-
62
-
63
-
64
-
65
-
66
-
67
-
68
-
69
-
70
-
71
-
72
-
73
-
74
-
75
-
76
-
77
-
78
-
79
-
80
-
81
-
82
-
 83
83 -
 84
84 -
 85
85 -
 86
86 -
 87
87 -
 88
88 -
 89
89 -
 90
90 -
 91
91 -
 92
92 -
 93
93 -
 94
94 -
 95
95 -
 96
96 -
 97
97 -
 98
98 -
 99
99 -
 100
100 -
 101
101 -
 102
102 -
 103
103 -
104
-
105
-
106
-
107
-
108
-
109
-
110
-
111
-
112
-
113
-
114
-
115
-
116
-
117
-
118
-
119
-
120
-
121
-
122
-
123
-
124
-
125
-
126
-
127
-
128
-
129
-
130
-
131
-
132
-
133
-
134
-
135
-
136
-
137
-
138
-
139
-
140
-
141
-
142
-
143
-
144
-
145
-
146
-
147
-
148
-
149
-
150
-
151
-
152
-
153
-
154
-
155
-
156
-
157
-
158
-
159
-
160
-
161
-
162
-
163
-
164
-
165
-
166
-
167
-
168
-
169
-
170
-
171
-
172
-
173
-
174
-
175
-
176
-
177
-
178
-
179
-
180
-
181
-
182
-
183
-
184
-
185
-
186
-
187
-
188
-
189
-
190
-
191
-
192
-
193
-
194
-
195
-
196
-
197
-
198
-
199
-
200
-
201
-
202
-
203
-
204
-
205
-
206
-
207
-
208
-
209
-
210
-
211
-
212
-
213
-
214
-
215
-
216
-
217
-
218
-
219
-
220
-
221
-
222
-
223
-
224
-
225
-
226
-
227
-
228
-
229
-
230
-
231
-
232
-
233
-
234
-
235
-
236
-
237
-
238
-
239
-
240
-
241
-
242
-
243
-
244
-
245
-
246
-
247
-
248
-
249
-
250
-
251
-
252
-
253
-
254
-
255
-
256
-
257
-
258
-
259
-
260
-
261
-
262
-
263
-
264
-
265
-
266
-
267
-
268
 |
 |

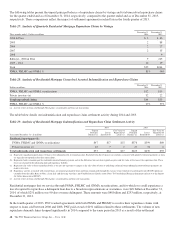
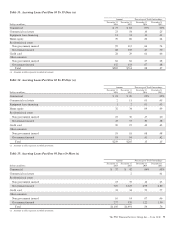
Table 33: Accruing Loans Past Due 30 To 59 Days (a)
Amount Percentage of Total Outstandings
Dollars in millions
December 31
2014
December 31
2013
December 31
2014
December 31
2013
Commercial $ 73 $ 81 .07% .09%
Commercial real estate 23 54 .10 .25
Equipment lease financing 11 31 .14 .41
Home equity 70 86 .20 .24
Residential real estate
Non government insured 95 112 .66 .74
Government insured 68 105 .47 .70
Credit card 28 29 .61 .66
Other consumer
Non government insured 62 62 .27 .28
Government insured 152 154 .67 .68
Total $582 $714 .28 .37
(a) Amounts in table represent recorded investment.
Table 34: Accruing Loans Past Due 60 To 89 Days (a)
Amount Percentage of Total Outstandings
Dollars in millions
December 31
2014
December 31
2013
December 31
2014
December 31
2013
Commercial $ 24 $ 20 .02% .02%
Commercial real estate 2 11 .01 .05
Equipment lease financing 1 2 .01 .03
Home equity 32 34 .09 .09
Residential real estate
Non government insured 25 30 .17 .20
Government insured 43 57 .30 .38
Credit card 20 19 .43 .43
Other consumer
Non government insured 19 18 .08 .08
Government insured 93 94 .41 .42
Total $259 $285 .13 .15
(a) Amounts in table represent recorded investment.
Table 35: Accruing Loans Past Due 90 Days Or More (a)
Amount Percentage of Total Outstandings
Dollars in millions
December 31
2014
December 31
2013
December 31
2014
December 31
2013
Commercial $ 37 $ 42 .04% .05%
Commercial real estate 2 .01
Residential real estate
Non government insured 23 35 .16 .23
Government insured 719 1,025 4.99 6.80
Credit card 33 34 .72 .77
Other consumer
Non government insured 16 14 .07 .06
Government insured 277 339 1.22 1.50
Total $1,105 $1,491 .54 .76
(a) Amounts in table represent recorded investment.
The PNC Financial Services Group, Inc. – Form 10-K 75