PNC Bank 2014 Annual Report Download - page 180
Download and view the complete annual report
Please find page 180 of the 2014 PNC Bank annual report below. You can navigate through the pages in the report by either clicking on the pages listed below, or by using the keyword search tool below to find specific information within the annual report.-
 1
1 -
2
-
3
-
4
-
5
-
6
-
7
-
8
-
9
-
10
-
11
-
12
-
13
-
14
-
15
-
16
-
17
-
18
-
19
-
20
-
21
-
22
-
23
-
24
-
25
-
26
-
27
-
28
-
29
-
30
-
31
-
32
-
33
-
34
-
35
-
36
-
37
-
38
-
39
-
40
-
41
-
42
-
43
-
44
-
45
-
46
-
47
-
48
-
49
-
50
-
51
-
52
-
53
-
54
-
55
-
56
-
57
-
58
-
59
-
60
-
61
-
62
-
63
-
64
-
65
-
66
-
67
-
68
-
69
-
70
-
71
-
72
-
73
-
74
-
75
-
76
-
77
-
78
-
79
-
80
-
81
-
82
-
83
-
84
-
85
-
86
-
87
-
88
-
89
-
90
-
91
-
92
-
93
-
94
-
95
-
96
-
97
-
98
-
99
-
100
-
101
-
102
-
103
-
104
-
105
-
106
-
107
-
108
-
109
-
110
-
111
-
112
-
113
-
114
-
115
-
116
-
117
-
118
-
119
-
120
-
121
-
122
-
123
-
124
-
125
-
126
-
127
-
128
-
129
-
130
-
131
-
132
-
133
-
134
-
135
-
136
-
137
-
138
-
139
-
140
-
141
-
142
-
143
-
144
-
145
-
146
-
147
-
148
-
149
-
150
-
151
-
152
-
153
-
154
-
155
-
156
-
157
-
158
-
159
-
160
-
161
-
162
-
163
-
164
-
165
-
166
-
167
-
168
-
169
-
 170
170 -
 171
171 -
 172
172 -
 173
173 -
 174
174 -
 175
175 -
 176
176 -
 177
177 -
 178
178 -
 179
179 -
 180
180 -
 181
181 -
 182
182 -
 183
183 -
 184
184 -
 185
185 -
 186
186 -
 187
187 -
 188
188 -
 189
189 -
 190
190 -
191
-
192
-
193
-
194
-
195
-
196
-
197
-
198
-
199
-
200
-
201
-
202
-
203
-
204
-
205
-
206
-
207
-
208
-
209
-
210
-
211
-
212
-
213
-
214
-
215
-
216
-
217
-
218
-
219
-
220
-
221
-
222
-
223
-
224
-
225
-
226
-
227
-
228
-
229
-
230
-
231
-
232
-
233
-
234
-
235
-
236
-
237
-
238
-
239
-
240
-
241
-
242
-
243
-
244
-
245
-
246
-
247
-
248
-
249
-
250
-
251
-
252
-
253
-
254
-
255
-
256
-
257
-
258
-
259
-
260
-
261
-
262
-
263
-
264
-
265
-
266
-
267
-
268
 |
 |

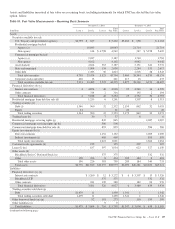
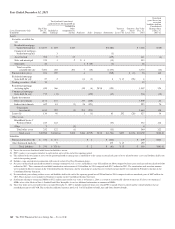
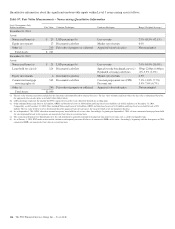
Quantitative information about the significant unobservable inputs within Level 3 recurring assets and liabilities follows.
Table 85: Fair Value Measurements – Recurring Quantitative Information
December 31, 2014
Level 3 Instruments Only
Dollars in millions Fair Value Valuation Techniques Unobservable Inputs Range (Weighted Average)
Residential mortgage-backed non-
agency securities
$4,798 Priced by a third-party vendor
using a discounted cash flow
pricing model (a)
Constant prepayment rate (CPR)
Constant default rate (CDR)
Loss severity
Spread over the benchmark curve (b)
1.0%-28.9% (6.8%)
0%-16.7% (5.6%)
6.1%-100.0% (53.1%)
249bps weighted average
(a)
(a)
(a)
(a)
Asset-backed securities 563 Priced by a third-party vendor
using a discounted cash flow
pricing model (a)
Constant prepayment rate (CPR)
Constant default rate (CDR)
Loss severity
Spread over the benchmark curve (b)
1.0%-15.7% (5.9%)
1.7%-13.9% (7.6%)
14.6%-100% (73.5%)
352bps weighted average
(a)
(a)
(a)
(a)
State and municipal securities 132
2
Discounted cash flow
Consensus pricing (c)
Spread over the benchmark curve (b)
Credit and Liquidity discount
55bps-165bps (67bps)
0%-20.0% (14.9%)
Other debt securities 30 Consensus pricing (c) Credit and Liquidity discount 7.0%-95.0% (88.6%)
Trading securities – Debt 32 Consensus pricing (c) Credit and Liquidity discount 0.0%-15.0% (8.0%)
Residential mortgage servicing rights 845 Discounted cash flow Constant prepayment rate (CPR)
Spread over the benchmark curve (b)
3.8%-32.7% (11.2%)
889bps-1,888bps (1,036bps)
Commercial mortgage servicing
rights
506 Discounted cash flow Constant prepayment rate (CPR)
Discount rate
7.0%-16.8% (8.0%)
2.5%-8.6% (6.6%)
Commercial mortgage loans held for
sale
893 Discounted cash flow Spread over the benchmark curve (b)
Estimated servicing cash flows
37bps-4,025bps (549bps)
0.0%-2.0% (1.2%)
Equity investments – Direct
investments 1,152 Multiple of adjusted earnings Multiple of earnings 3.2x-13.9x (7.7x)
Equity investments – Indirect (d) 469 Net asset value Net asset value
Loans – Residential real estate 114
154
Consensus pricing (c)
Discounted cash flow
Cumulative default rate
Loss severity
Discount rate
Loss severity
Discount rate
2.0%-100% (90.5%)
0%-100% (35.6%)
5.4%-7.0% (6.4%)
8.0% weighted average
3.4% weighted average
Loans – Home equity 129 Consensus pricing (c) Credit and Liquidity discount 26.0%-99.0% (51.0%)
BlackRock Series C Preferred Stock 375 Consensus pricing (c) Liquidity discount 20.0%
BlackRock LTIP (375) Consensus pricing (c) Liquidity discount 20.0%
Swaps related to sales of certain Visa
Class B common shares
(135) Discounted cash flow Estimated conversion factor of
Class B shares into Class A shares
Estimated growth rate of Visa
Class A share price
41.1%
14.8%
Other borrowed funds – non-agency
securitization
(166) Consensus pricing (c) Credit and Liquidity discount
Spread over the benchmark curve (b)
0%-99.0% (18.0%)
113bps
Insignificant Level 3 assets, net of
liabilities (e) 23
Total Level 3 assets, net of liabilities (f) $9,541
162 The PNC Financial Services Group, Inc. – Form 10-K