PNC Bank 2014 Annual Report Download - page 146
Download and view the complete annual report
Please find page 146 of the 2014 PNC Bank annual report below. You can navigate through the pages in the report by either clicking on the pages listed below, or by using the keyword search tool below to find specific information within the annual report.-
 1
1 -
2
-
3
-
4
-
5
-
6
-
7
-
8
-
9
-
10
-
11
-
12
-
13
-
14
-
15
-
16
-
17
-
18
-
19
-
20
-
21
-
22
-
23
-
24
-
25
-
26
-
27
-
28
-
29
-
30
-
31
-
32
-
33
-
34
-
35
-
36
-
37
-
38
-
39
-
40
-
41
-
42
-
43
-
44
-
45
-
46
-
47
-
48
-
49
-
50
-
51
-
52
-
53
-
54
-
55
-
56
-
57
-
58
-
59
-
60
-
61
-
62
-
63
-
64
-
65
-
66
-
67
-
68
-
69
-
70
-
71
-
72
-
73
-
74
-
75
-
76
-
77
-
78
-
79
-
80
-
81
-
82
-
83
-
84
-
85
-
86
-
87
-
88
-
89
-
90
-
91
-
92
-
93
-
94
-
95
-
96
-
97
-
98
-
99
-
100
-
101
-
102
-
103
-
104
-
105
-
106
-
107
-
108
-
109
-
110
-
111
-
112
-
113
-
114
-
115
-
116
-
117
-
118
-
119
-
120
-
121
-
122
-
123
-
124
-
125
-
126
-
127
-
128
-
129
-
130
-
131
-
132
-
133
-
134
-
135
-
 136
136 -
 137
137 -
 138
138 -
 139
139 -
 140
140 -
 141
141 -
 142
142 -
 143
143 -
 144
144 -
 145
145 -
 146
146 -
 147
147 -
 148
148 -
 149
149 -
 150
150 -
 151
151 -
 152
152 -
 153
153 -
 154
154 -
 155
155 -
 156
156 -
157
-
158
-
159
-
160
-
161
-
162
-
163
-
164
-
165
-
166
-
167
-
168
-
169
-
170
-
171
-
172
-
173
-
174
-
175
-
176
-
177
-
178
-
179
-
180
-
181
-
182
-
183
-
184
-
185
-
186
-
187
-
188
-
189
-
190
-
191
-
192
-
193
-
194
-
195
-
196
-
197
-
198
-
199
-
200
-
201
-
202
-
203
-
204
-
205
-
206
-
207
-
208
-
209
-
210
-
211
-
212
-
213
-
214
-
215
-
216
-
217
-
218
-
219
-
220
-
221
-
222
-
223
-
224
-
225
-
226
-
227
-
228
-
229
-
230
-
231
-
232
-
233
-
234
-
235
-
236
-
237
-
238
-
239
-
240
-
241
-
242
-
243
-
244
-
245
-
246
-
247
-
248
-
249
-
250
-
251
-
252
-
253
-
254
-
255
-
256
-
257
-
258
-
259
-
260
-
261
-
262
-
263
-
264
-
265
-
266
-
267
-
268
 |
 |

significantly impact the economic performance of the entity.
However, certain partnership or LLC agreements provide the
limited partner or non-managing member the ability to remove
the general partner or managing member without cause. This
results in the limited partner or non-managing member being
the party that has the right to make decisions that will most
significantly impact the economic performance of the entity.
The primary sources of benefits for these investments are the
tax credits and passive losses which reduce our tax liability.
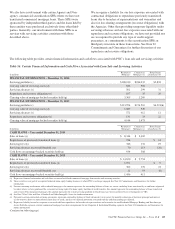
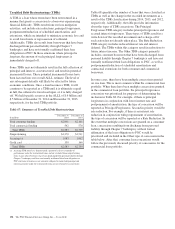
We have consolidated investments in which we have the
power to direct the activities that most significantly impact the
entity’s performance, and have an obligation to absorb
expected losses or receive benefits that could be potentially
significant. The assets are primarily included in Equity
investments and Other assets on our Consolidated Balance
Sheet with the liabilities classified in Other borrowed funds,
Accrued expenses, and Other liabilities and the third-party
investors’ interests included in the Equity section as
Noncontrolling interests. Neither creditors nor equity investors
in these investments have any recourse to our general credit.
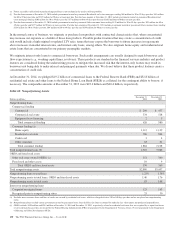
The consolidated assets and liabilities of these investments are
provided in Table 58 and are reflected in the “Other” business
segment.
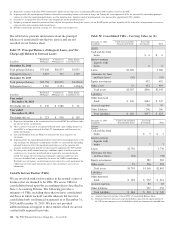
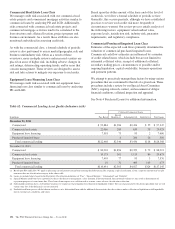
For tax credit investments in which we do not have the right to
make decisions that will most significantly impact the
economic performance of the entity, we are not the primary
beneficiary and thus they are not consolidated. These
investments are disclosed in Table 59. The table also reflects
our maximum exposure to loss exclusive of any potential tax
credit recapture. Our maximum exposure to loss is equal to
our legally binding equity commitments adjusted for recorded
impairment, partnership results, or amortization for qualifying
low income housing tax credit investments when applicable.
For all legally binding unfunded equity commitments, we
increase our recognized investment and recognize a liability.
As of December 31, 2014, we had a liability of $441 million
related to investments in qualified affordable housing projects
which is reflected in Other liabilities on our Consolidated
Balance Sheet.
Table 59 also includes our involvement in lease financing
transactions with LLCs engaged in solar power generation that
to a large extent provided returns in the form of tax credits.
The outstanding financings and operating lease assets are
reflected as Loans and Other assets, respectively, on our
Consolidated Balance Sheet, whereas related liabilities are
reported in Deposits and Other liabilities.
Residential and Commercial Mortgage-Backed
Securitizations
In connection with each Agency and Non-agency
securitization discussed above, we evaluate each SPE utilized
in these transactions for consolidation. In performing these
assessments, we evaluate our level of continuing involvement
in these transactions as the nature of our involvement
ultimately determines whether or not we hold a variable
interest and/or are the primary beneficiary of the SPE. Factors
we consider in our consolidation assessment include the
significance of (i) our role as servicer, (ii) our holdings of
mortgage-backed securities issued by the securitization SPE,
and (iii) the rights of third-party variable interest holders.
The first step in our assessment is to determine whether we
hold a variable interest in the securitization SPE. We hold
variable interests in Agency and Non-agency securitization
SPEs through our holding of mortgage-backed securities
issued by the SPEs and/or our recourse obligations. Each SPE
in which we hold a variable interest is evaluated to determine
whether we are the primary beneficiary of the entity. For
Agency securitization transactions, our contractual role as
servicer does not give us the power to direct the activities that
most significantly affect the economic performance of the
SPEs. Thus, we are not the primary beneficiary of these
entities. For Non-agency securitization transactions, we would
be the primary beneficiary to the extent our servicing activities
give us the power to direct the activities that most
significantly affect the economic performance of the SPE and
we hold a more than insignificant variable interest in the
entity.
Details about the Agency and Non-agency securitization SPEs
where we hold a variable interest and are not the primary
beneficiary are included in Table 59. Our maximum exposure
to loss as a result of our involvement with these SPEs is the
carrying value of the mortgage-backed securities, servicing
assets, servicing advances, and our liabilities associated with
our recourse obligations. Creditors of the securitization SPEs
have no recourse to PNC’s assets or general credit.
N
OTE
3A
SSET
Q
UALITY
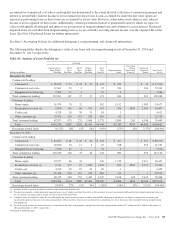
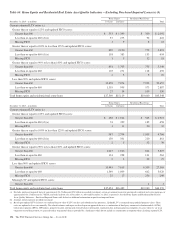
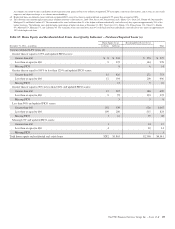
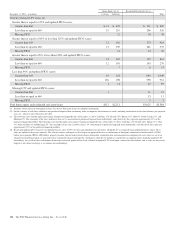
Asset Quality
We closely monitor economic conditions and loan
performance trends to manage and evaluate our exposure to
credit risk. Trends in delinquency rates may be a key
indicator, among other considerations, of credit risk within the
loan portfolios. The measurement of delinquency status is
based on the contractual terms of each loan. Loans that are 30
days or more past due in terms of payment are considered
delinquent. Loan delinquencies exclude loans held for sale,
purchased impaired loans, nonperforming loans and loans
accounted for under the fair value option which are on
nonaccrual status, but include government insured or
guaranteed loans and accruing loans accounted for under the
fair value option.
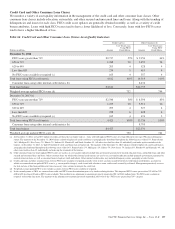
The trends in nonperforming assets represent another key
indicator of the potential for future credit losses.
Nonperforming assets include nonperforming loans, OREO
and foreclosed assets. Nonperforming loans are those loans
128 The PNC Financial Services Group, Inc. – Form 10-K