PNC Bank 2014 Annual Report Download - page 91
Download and view the complete annual report
Please find page 91 of the 2014 PNC Bank annual report below. You can navigate through the pages in the report by either clicking on the pages listed below, or by using the keyword search tool below to find specific information within the annual report.-
 1
1 -
2
-
3
-
4
-
5
-
6
-
7
-
8
-
9
-
10
-
11
-
12
-
13
-
14
-
15
-
16
-
17
-
18
-
19
-
20
-
21
-
22
-
23
-
24
-
25
-
26
-
27
-
28
-
29
-
30
-
31
-
32
-
33
-
34
-
35
-
36
-
37
-
38
-
39
-
40
-
41
-
42
-
43
-
44
-
45
-
46
-
47
-
48
-
49
-
50
-
51
-
52
-
53
-
54
-
55
-
56
-
57
-
58
-
59
-
60
-
61
-
62
-
63
-
64
-
65
-
66
-
67
-
68
-
69
-
70
-
71
-
72
-
73
-
74
-
75
-
76
-
77
-
78
-
79
-
80
-
 81
81 -
 82
82 -
 83
83 -
 84
84 -
 85
85 -
 86
86 -
 87
87 -
 88
88 -
 89
89 -
 90
90 -
 91
91 -
 92
92 -
 93
93 -
 94
94 -
 95
95 -
 96
96 -
 97
97 -
 98
98 -
 99
99 -
 100
100 -
 101
101 -
102
-
103
-
104
-
105
-
106
-
107
-
108
-
109
-
110
-
111
-
112
-
113
-
114
-
115
-
116
-
117
-
118
-
119
-
120
-
121
-
122
-
123
-
124
-
125
-
126
-
127
-
128
-
129
-
130
-
131
-
132
-
133
-
134
-
135
-
136
-
137
-
138
-
139
-
140
-
141
-
142
-
143
-
144
-
145
-
146
-
147
-
148
-
149
-
150
-
151
-
152
-
153
-
154
-
155
-
156
-
157
-
158
-
159
-
160
-
161
-
162
-
163
-
164
-
165
-
166
-
167
-
168
-
169
-
170
-
171
-
172
-
173
-
174
-
175
-
176
-
177
-
178
-
179
-
180
-
181
-
182
-
183
-
184
-
185
-
186
-
187
-
188
-
189
-
190
-
191
-
192
-
193
-
194
-
195
-
196
-
197
-
198
-
199
-
200
-
201
-
202
-
203
-
204
-
205
-
206
-
207
-
208
-
209
-
210
-
211
-
212
-
213
-
214
-
215
-
216
-
217
-
218
-
219
-
220
-
221
-
222
-
223
-
224
-
225
-
226
-
227
-
228
-
229
-
230
-
231
-
232
-
233
-
234
-
235
-
236
-
237
-
238
-
239
-
240
-
241
-
242
-
243
-
244
-
245
-
246
-
247
-
248
-
249
-
250
-
251
-
252
-
253
-
254
-
255
-
256
-
257
-
258
-
259
-
260
-
261
-
262
-
263
-
264
-
265
-
266
-
267
-
268
 |
 |

through Chapter 7 bankruptcy and have not formally
reaffirmed their loan obligations to PNC and loans to
borrowers not currently obligated to make both principal and
interest payments under the restructured terms are not returned
to accrual status.
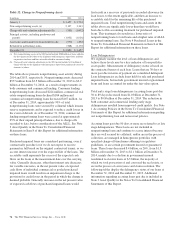
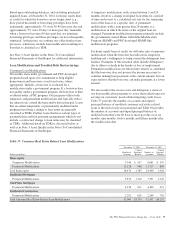
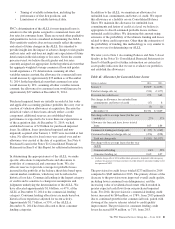
At December 31, 2014, our largest nonperforming asset was
$35 million in the Real Estate, Rental and Leasing Industry
and our average nonperforming loans associated with
commercial lending were under $1 million. All of the ten
largest outstanding nonperforming assets are from the
commercial lending portfolio and represent 21% and 4% of
total commercial lending nonperforming loans and total
nonperforming assets, respectively, as of December 31, 2014.
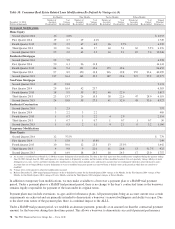
Table 30: Nonperforming Assets By Type
Dollars in millions
December 31
2014
December 31
2013
Nonperforming loans
Commercial lending
Commercial
Retail/wholesale trade $ 48 $ 57
Manufacturing 59 58
Service providers 67 108
Real estate related (a) 66 124
Financial services 4 7
Health care 28 19
Other industries 18 84
Total commercial 290 457
Commercial real estate
Real estate projects (b) 290 436
Commercial mortgage 44 82
Total commercial real estate 334 518
Equipment lease financing 2 5
Total commercial lending 626 980
Consumer lending (c)
Home equity 1,112 1,139
Residential real estate
Residential mortgage 694 890
Residential construction 12 14
Credit card 3 4
Other consumer 63 61
Total consumer lending 1,884 2,108
Total nonperforming loans (d) 2,510 3,088
OREO and foreclosed assets
Other real estate owned (OREO) (e) 351 360
Foreclosed and other assets 19 9
Total OREO and foreclosed
assets 370 369
Total nonperforming assets $2,880 $3,457
Amount of TDRs included in nonperforming
loans $1,370 $1,511
Percentage of total nonperforming loans 55% 49%
Nonperforming loans to total loans 1.23% 1.58%
Nonperforming assets to total loans, OREO
and foreclosed assets 1.40 1.76
Nonperforming assets to total assets 0.83 1.08
Allowance for loan and lease losses to total
nonperforming loans (f) 133 117
(a) Includes loans related to customers in the real estate and construction industries.
(b) Includes both construction loans and intermediate financing for projects.
(c) Excludes most consumer loans and lines of credit, not secured by residential real
estate, which are charged off after 120 to 180 days past due and are not placed on
nonperforming status.
(d) Nonperforming loans exclude certain government insured or guaranteed loans, loans
held for sale, loans accounted for under the fair value option and purchased impaired
loans.
(e) OREO excludes $194 million and $245 million at December 31, 2014 and
December 31, 2013, respectively, related to commercial and residential real estate
that was acquired by us upon foreclosure of serviced loans because they are insured
by the FHA or guaranteed by the VA or guaranteed by the Department of Housing
and Urban Development.
(f) The allowance for loan and lease losses includes impairment reserves attributable to
purchased impaired loans. See Note 1 Accounting Policies and Note 5 Allowances
for Loan and Lease Losses and Unfunded Loan Commitments and Letters of Credit
in the Notes To Consolidated Financial Statements in Item 8 of this Report for
additional information.
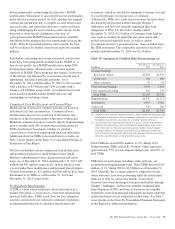
Table 31: OREO and Foreclosed Assets
In millions
December 31
2014
December 31
2013
Other real estate owned (OREO):
Residential properties $183 $164
Residential development properties 48 74
Commercial properties 120 122
Total OREO 351 360
Foreclosed and other assets 19 9
Total OREO and foreclosed assets $370 $369
Total OREO and foreclosed assets increased $1 million during
2014 from $369 million at December 31, 2013 to $370 million
at December 31, 2014 and is 13% of total nonperforming
assets at December 31, 2014. As of December 31, 2014 and
December 31, 2013, 62% and 64%, respectively, of our
OREO and foreclosed assets were comprised of residential
related properties.
The PNC Financial Services Group, Inc. – Form 10-K 73