PNC Bank 2014 Annual Report Download - page 126
Download and view the complete annual report
Please find page 126 of the 2014 PNC Bank annual report below. You can navigate through the pages in the report by either clicking on the pages listed below, or by using the keyword search tool below to find specific information within the annual report.-
 1
1 -
2
-
3
-
4
-
5
-
6
-
7
-
8
-
9
-
10
-
11
-
12
-
13
-
14
-
15
-
16
-
17
-
18
-
19
-
20
-
21
-
22
-
23
-
24
-
25
-
26
-
27
-
28
-
29
-
30
-
31
-
32
-
33
-
34
-
35
-
36
-
37
-
38
-
39
-
40
-
41
-
42
-
43
-
44
-
45
-
46
-
47
-
48
-
49
-
50
-
51
-
52
-
53
-
54
-
55
-
56
-
57
-
58
-
59
-
60
-
61
-
62
-
63
-
64
-
65
-
66
-
67
-
68
-
69
-
70
-
71
-
72
-
73
-
74
-
75
-
76
-
77
-
78
-
79
-
80
-
81
-
82
-
83
-
84
-
85
-
86
-
87
-
88
-
89
-
90
-
91
-
92
-
93
-
94
-
95
-
96
-
97
-
98
-
99
-
100
-
101
-
102
-
103
-
104
-
105
-
106
-
107
-
108
-
109
-
110
-
111
-
112
-
113
-
114
-
115
-
 116
116 -
 117
117 -
 118
118 -
 119
119 -
 120
120 -
 121
121 -
 122
122 -
 123
123 -
 124
124 -
 125
125 -
 126
126 -
 127
127 -
 128
128 -
 129
129 -
 130
130 -
 131
131 -
 132
132 -
 133
133 -
 134
134 -
 135
135 -
 136
136 -
137
-
138
-
139
-
140
-
141
-
142
-
143
-
144
-
145
-
146
-
147
-
148
-
149
-
150
-
151
-
152
-
153
-
154
-
155
-
156
-
157
-
158
-
159
-
160
-
161
-
162
-
163
-
164
-
165
-
166
-
167
-
168
-
169
-
170
-
171
-
172
-
173
-
174
-
175
-
176
-
177
-
178
-
179
-
180
-
181
-
182
-
183
-
184
-
185
-
186
-
187
-
188
-
189
-
190
-
191
-
192
-
193
-
194
-
195
-
196
-
197
-
198
-
199
-
200
-
201
-
202
-
203
-
204
-
205
-
206
-
207
-
208
-
209
-
210
-
211
-
212
-
213
-
214
-
215
-
216
-
217
-
218
-
219
-
220
-
221
-
222
-
223
-
224
-
225
-
226
-
227
-
228
-
229
-
230
-
231
-
232
-
233
-
234
-
235
-
236
-
237
-
238
-
239
-
240
-
241
-
242
-
243
-
244
-
245
-
246
-
247
-
248
-
249
-
250
-
251
-
252
-
253
-
254
-
255
-
256
-
257
-
258
-
259
-
260
-
261
-
262
-
263
-
264
-
265
-
266
-
267
-
268
 |
 |

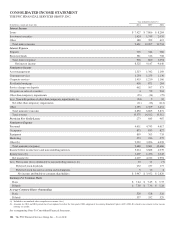
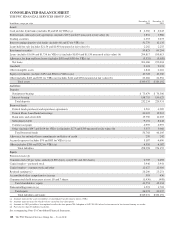
CONSOLIDATED BALANCE SHEET
THE PNC FINANCIAL SERVICES GROUP, INC.
In millions, except par value
December 31
2014
December 31
2013
Assets
Cash and due from banks (includes $6 and $5 for VIEs) (a) $ 4,360 $ 4,043
Federal funds sold and resale agreements (includes $155 and $207 measured at fair value) (b) 1,852 1,986
Trading securities 2,353 3,073
Interest-earning deposits with banks (includes $6 and $7 for VIEs) (a) 31,779 12,135
Loans held for sale (includes $2,154 and $1,901 measured at fair value) (b) 2,262 2,255
Investment securities 55,823 60,294
Loans (includes $1,606 and $1,736 for VIEs) (a) (includes $1,034 and $1,150 measured at fair value) (b) 204,817 195,613
Allowance for loan and lease losses (includes $(50) and $(58) for VIEs) (a) (3,331) (3,609)
Net loans 201,486 192,004
Goodwill 9,103 9,074
Other intangible assets 1,844 2,216
Equity investments (includes $492 and $582 for VIEs) (a)(c) 10,728 10,560
Other (includes $483 and $591 for VIEs) (a) (includes $412 and $338 measured at fair value) (b) 23,482 22,552
Total assets $345,072 $320,192
Liabilities
Deposits
Noninterest-bearing $ 73,479 $ 70,306
Interest-bearing 158,755 150,625
Total deposits 232,234 220,931
Borrowed funds
Federal funds purchased and repurchase agreements 3,510 4,289
Federal Home Loan Bank borrowings 20,005 12,912
Bank notes and senior debt 15,750 12,603
Subordinated debt 9,151 8,244
Commercial paper 4,995 4,997
Other (includes $347 and $414 for VIEs) (a) (includes $273 and $309 measured at fair value) (b) 3,357 3,060
Total borrowed funds 56,768 46,105
Allowance for unfunded loan commitments and letters of credit 259 242
Accrued expenses (includes $70 and $83 for VIEs) (a) (c) 5,187 4,690
Other (includes $206 and $252 for VIEs) (a) 4,550 4,187
Total liabilities 298,998 276,155
Equity
Preferred stock (d)
Common stock ($5 par value, authorized 800 shares, issued 541 and 540 shares) 2,705 2,698
Capital surplus – preferred stock 3,946 3,941
Capital surplus – common stock and other 12,627 12,416
Retained earnings (c) 26,200 23,251
Accumulated other comprehensive income 503 436
Common stock held in treasury at cost: 18 and 7 shares (1,430) (408)
Total shareholders’ equity 44,551 42,334
Noncontrolling interests (c) 1,523 1,703
Total equity 46,074 44,037
Total liabilities and equity $345,072 $320,192
(a) Amounts represent the assets or liabilities of consolidated variable interest entities (VIEs).
(b) Amounts represent items for which we have elected the fair value option.
(c) Amounts for 2013 period have been updated to reflect the first quarter 2014 adoption of ASU 2014-01 related to investments in low income housing tax credits.
(d) Par value less than $.5 million at each date.
See accompanying Notes To Consolidated Financial Statements.
108 The PNC Financial Services Group, Inc. – Form 10-K