PNC Bank 2014 Annual Report Download - page 100
Download and view the complete annual report
Please find page 100 of the 2014 PNC Bank annual report below. You can navigate through the pages in the report by either clicking on the pages listed below, or by using the keyword search tool below to find specific information within the annual report.-
 1
1 -
2
-
3
-
4
-
5
-
6
-
7
-
8
-
9
-
10
-
11
-
12
-
13
-
14
-
15
-
16
-
17
-
18
-
19
-
20
-
21
-
22
-
23
-
24
-
25
-
26
-
27
-
28
-
29
-
30
-
31
-
32
-
33
-
34
-
35
-
36
-
37
-
38
-
39
-
40
-
41
-
42
-
43
-
44
-
45
-
46
-
47
-
48
-
49
-
50
-
51
-
52
-
53
-
54
-
55
-
56
-
57
-
58
-
59
-
60
-
61
-
62
-
63
-
64
-
65
-
66
-
67
-
68
-
69
-
70
-
71
-
72
-
73
-
74
-
75
-
76
-
77
-
78
-
79
-
80
-
81
-
82
-
83
-
84
-
85
-
86
-
87
-
88
-
89
-
 90
90 -
 91
91 -
 92
92 -
 93
93 -
 94
94 -
 95
95 -
 96
96 -
 97
97 -
 98
98 -
 99
99 -
 100
100 -
 101
101 -
 102
102 -
 103
103 -
 104
104 -
 105
105 -
 106
106 -
 107
107 -
 108
108 -
 109
109 -
 110
110 -
111
-
112
-
113
-
114
-
115
-
116
-
117
-
118
-
119
-
120
-
121
-
122
-
123
-
124
-
125
-
126
-
127
-
128
-
129
-
130
-
131
-
132
-
133
-
134
-
135
-
136
-
137
-
138
-
139
-
140
-
141
-
142
-
143
-
144
-
145
-
146
-
147
-
148
-
149
-
150
-
151
-
152
-
153
-
154
-
155
-
156
-
157
-
158
-
159
-
160
-
161
-
162
-
163
-
164
-
165
-
166
-
167
-
168
-
169
-
170
-
171
-
172
-
173
-
174
-
175
-
176
-
177
-
178
-
179
-
180
-
181
-
182
-
183
-
184
-
185
-
186
-
187
-
188
-
189
-
190
-
191
-
192
-
193
-
194
-
195
-
196
-
197
-
198
-
199
-
200
-
201
-
202
-
203
-
204
-
205
-
206
-
207
-
208
-
209
-
210
-
211
-
212
-
213
-
214
-
215
-
216
-
217
-
218
-
219
-
220
-
221
-
222
-
223
-
224
-
225
-
226
-
227
-
228
-
229
-
230
-
231
-
232
-
233
-
234
-
235
-
236
-
237
-
238
-
239
-
240
-
241
-
242
-
243
-
244
-
245
-
246
-
247
-
248
-
249
-
250
-
251
-
252
-
253
-
254
-
255
-
256
-
257
-
258
-
259
-
260
-
261
-
262
-
263
-
264
-
265
-
266
-
267
-
268
 |
 |

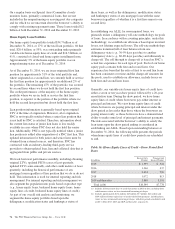
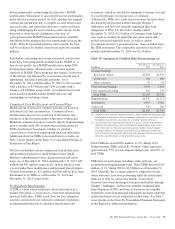
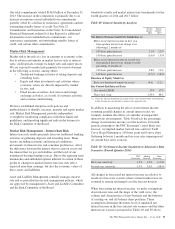
At December 31, 2014, total ALLL to total nonperforming
loans was 133%. The comparable amount for December 31,
2013 was 117%. These ratios are 85% and 72%, respectively,
when excluding the $1.2 billion and $1.4 billion, respectively,
of ALLL at December 31, 2014 and December 31, 2013
allocated to consumer loans and lines of credit not secured by
residential real estate and purchased impaired loans. We have
excluded consumer loans and lines of credit not secured by
real estate as they are charged off after 120 to 180 days past
due and not placed on nonperforming status. Additionally, we
have excluded purchased impaired loans as they are
considered performing regardless of their delinquency status
as interest is accreted in accordance with ASC 310-30 based
on the recorded investment balance. Additional allowance is
recorded when the net present value of expected cash flows is
lower than the recorded investment balance. See Table 30
within this Credit Risk Management section for additional
information.
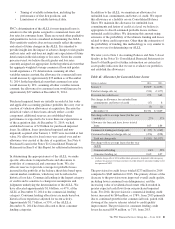
The ALLL balance increases or decreases across periods in
relation to fluctuating risk factors, including asset quality
trends, net charge-offs and changes in aggregate portfolio
balances. During 2014, improved asset quality trends,
including, but not limited to, delinquency status and
improving economic conditions, as well as reduced net
charge-offs and overall portfolio growth combined to result in
the ALLL balance declining $.3 billion, or 8% to $3.3 billion
as of December 31, 2014 compared to December 31, 2013.
See Note 1 Accounting Policies and Note 4 Purchased Loans
in the Notes To Consolidated Financial Statements in Item 8
of this Report regarding changes in the ALLL and in the
allowance for unfunded loan commitments and letters of
credit.
Operational Risk Management
Operational risk is the risk of loss resulting from inadequate or
failed internal processes or systems, human factors, or
external events. This includes losses that may arise as a result
of non-compliance with laws or regulations, failure to fulfill
fiduciary responsibilities, as well as litigation or other legal
actions. Operational risk may occur in any of our business
activities and manifests itself in various ways, including but
not limited to:
• Transaction processing errors,
• Unauthorized transactions and fraud by employees or
third parties,
• Material disruption in business activities,
• System breaches and misuse of sensitive information,
• Regulatory or governmental actions, fines or
penalties, and
• Significant legal expenses, judgments or settlements.
PNC’s Operational Risk Management is inclusive of
Technology Risk Management and Business Continuity Risk.
Enterprise Compliance is responsible for coordinating the
compliance risk component of PNC’s Operational Risk
framework. Operational Risk Management focuses on
balancing business needs, regulatory expectations and risk
management priorities through an adaptive and proactive
program that is designed to provide a strong governance
model, sound and consistent risk management processes and
transparent operational risk reporting across the enterprise.
The PNC Board determines the strategic approach to
operational risk via establishment of guiding principles, risk
appetite and appropriate risk management structure. This
includes establishment of risk metrics and limits and
operational risk committee hierarchy and reporting structure to
identify, understand and manage operational risks.
Executive Management has responsibility for operational risk
management. The executive management team is responsible
for monitoring significant risks, key controls and related
issues through management reporting and a governance
structure of risk committees, to help ensure that objectives are
pursued within the bounds of our risk appetite.
Within the Independent Risk Management function,
Operational Risk Management (ORM) is responsible for
developing and maintaining the policies, methodologies, tools,
and technology utilized across the enterprise to identify,
assess, monitor, and report operational risks. ORM monitors
enterprise-wide adherence with related policies and
procedures and regularly assesses overall program
effectiveness. In addition, ORM independently challenges the
results and conclusions generated by the business units during
the execution of the operational risk management program.
Business Unit management is responsible for the day-to-day
management of operational risks inherent in the products,
services, and activities for which they are responsible.
Business Unit management is also responsible for adhering to
PNC’s enterprise-wide operational risk management policies
and procedures including regularly identifying, measuring,
and monitoring operational risks in their respective areas, as
well as capturing, analyzing and reporting operational risks
and issues.
Management of operational risk is based upon a
comprehensive framework designed to enable PNC to
determine the enterprise and individual business unit’s
operational risk profile in comparison to the established risk
appetite and identify operational risks that may require further
mitigation. This framework is established around a set of
enterprise-wide policies and a system of internal controls that
are designed to manage risk and to provide management with
timely and accurate information about the operations of PNC.
This framework employs a number of techniques to manage
operational risk, including:
• Risk and Control Self Assessments (RCSAs) that are
performed at least annually across PNC’s businesses,
processes, systems and products. RCSA methodology
82 The PNC Financial Services Group, Inc. – Form 10-K