PNC Bank 2014 Annual Report Download - page 144
Download and view the complete annual report
Please find page 144 of the 2014 PNC Bank annual report below. You can navigate through the pages in the report by either clicking on the pages listed below, or by using the keyword search tool below to find specific information within the annual report.-
 1
1 -
2
-
3
-
4
-
5
-
6
-
7
-
8
-
9
-
10
-
11
-
12
-
13
-
14
-
15
-
16
-
17
-
18
-
19
-
20
-
21
-
22
-
23
-
24
-
25
-
26
-
27
-
28
-
29
-
30
-
31
-
32
-
33
-
34
-
35
-
36
-
37
-
38
-
39
-
40
-
41
-
42
-
43
-
44
-
45
-
46
-
47
-
48
-
49
-
50
-
51
-
52
-
53
-
54
-
55
-
56
-
57
-
58
-
59
-
60
-
61
-
62
-
63
-
64
-
65
-
66
-
67
-
68
-
69
-
70
-
71
-
72
-
73
-
74
-
75
-
76
-
77
-
78
-
79
-
80
-
81
-
82
-
83
-
84
-
85
-
86
-
87
-
88
-
89
-
90
-
91
-
92
-
93
-
94
-
95
-
96
-
97
-
98
-
99
-
100
-
101
-
102
-
103
-
104
-
105
-
106
-
107
-
108
-
109
-
110
-
111
-
112
-
113
-
114
-
115
-
116
-
117
-
118
-
119
-
120
-
121
-
122
-
123
-
124
-
125
-
126
-
127
-
128
-
129
-
130
-
131
-
132
-
133
-
 134
134 -
 135
135 -
 136
136 -
 137
137 -
 138
138 -
 139
139 -
 140
140 -
 141
141 -
 142
142 -
 143
143 -
 144
144 -
 145
145 -
 146
146 -
 147
147 -
 148
148 -
 149
149 -
 150
150 -
 151
151 -
 152
152 -
 153
153 -
 154
154 -
155
-
156
-
157
-
158
-
159
-
160
-
161
-
162
-
163
-
164
-
165
-
166
-
167
-
168
-
169
-
170
-
171
-
172
-
173
-
174
-
175
-
176
-
177
-
178
-
179
-
180
-
181
-
182
-
183
-
184
-
185
-
186
-
187
-
188
-
189
-
190
-
191
-
192
-
193
-
194
-
195
-
196
-
197
-
198
-
199
-
200
-
201
-
202
-
203
-
204
-
205
-
206
-
207
-
208
-
209
-
210
-
211
-
212
-
213
-
214
-
215
-
216
-
217
-
218
-
219
-
220
-
221
-
222
-
223
-
224
-
225
-
226
-
227
-
228
-
229
-
230
-
231
-
232
-
233
-
234
-
235
-
236
-
237
-
238
-
239
-
240
-
241
-
242
-
243
-
244
-
245
-
246
-
247
-
248
-
249
-
250
-
251
-
252
-
253
-
254
-
255
-
256
-
257
-
258
-
259
-
260
-
261
-
262
-
263
-
264
-
265
-
266
-
267
-
268
 |
 |
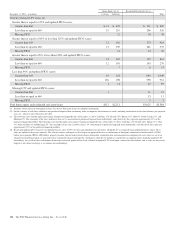
(g) Represents securities held where PNC transferred to and/or services loans for a securitization SPE and we hold securities issued by that SPE.
(h) In prior periods, the unpaid principal balance reflected the outstanding balance at the time of charge-off. During the second quarter of 2014, we corrected the outstanding principal
balance to reflect the unpaid principal balance as of the reporting date. Amounts reported in prior periods were decreased by approximately $581 million.
(i) Gains/losses recognized on sales of loans were insignificant for the periods presented.
(j) Includes government insured or guaranteed loans eligible for repurchase through the exercise of our ROAP option and loans repurchased due to breaches of origination covenants or
representations and warranties made to purchasers.
(k) Includes contractually specified servicing fees, late charges and ancillary fees.
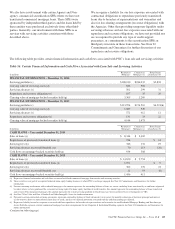
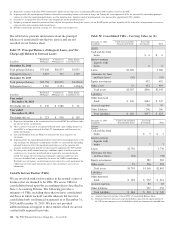
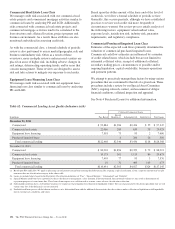
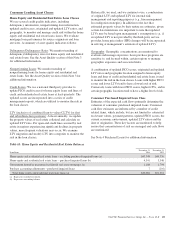
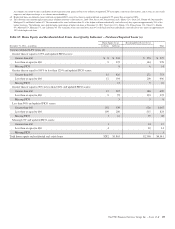
The table below presents information about the principal
balances of transferred loans that we service and are not
recorded on our balance sheet.
Table 57: Principal Balance, Delinquent Loans, and Net
Charge-offs Related to Serviced Loans
In millions
Residential
Mortgages
Commercial
Mortgages (a)
Home Equity
Loans/Lines (b)
December 31, 2014
Total principal balance $79,108 $60,873 $3,833
Delinquent loans (c) 2,657 707 1,303
December 31, 2013
Total principal balance $85,758 $62,872 $4,321(d)
Delinquent loans (c) 3,562 2,353 1,404(d)
In millions
Residential
Mortgages
Commercial
Mortgages (a)
Home Equity
Loans/Lines (b)
Year ended
December 31, 2014
Net charge-offs (e) $ 136 $ 1,288 $ 61
Year ended
December 31, 2013
Net charge-offs (e) $ 213 $ 916 $ 119
(a) Represents information at the securitization level in which PNC has sold loans and is
the servicer for the securitization.
(b) These activities were part of an acquired brokered home equity lending business in
which PNC is no longer engaged. See Note 22 Commitments and Guarantees for
further information.
(c) Serviced delinquent loans are 90 days or more past due or are in process of
foreclosure.
(d) In prior periods, the unpaid principal balance reflected the outstanding balance at the
time of charge-off. During the second quarter of 2014, we corrected the outstanding
principal balance to reflect the unpaid principal balance as of the reporting date.
Amounts reported in prior periods were decreased by approximately $581 million.
(e) Net charge-offs for Residential mortgages and Home equity loans/lines represent
credit losses less recoveries distributed and as reported to investors during the
period. Net charge-offs for Commercial mortgages represent credit losses less
recoveries distributed and as reported by the trustee for CMBS securitizations.
Realized losses for Agency securitizations are not reflected as we do not manage the
underlying real estate upon foreclosure and, as such, do not have access to loss
information.
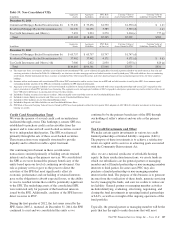
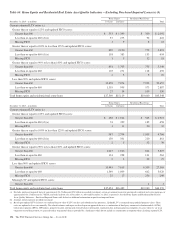
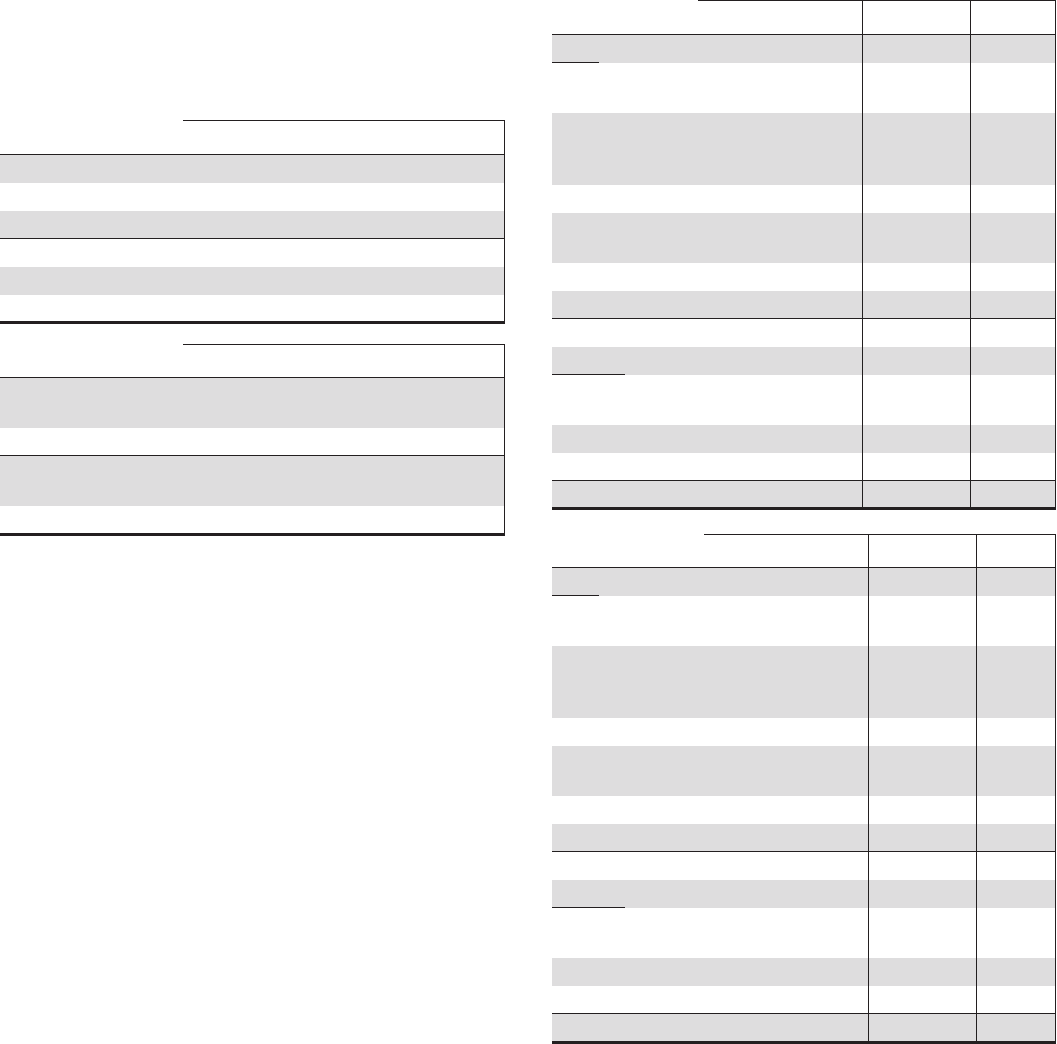
Variable Interest Entities (VIEs)
We are involved with various entities in the normal course of
business that are deemed to be VIEs. We assess VIEs for
consolidation based upon the accounting policies described in
Note 1 Accounting Policies. The following provides a
summary of VIEs, including those that we have consolidated
and those in which we hold variable interests but have not
consolidated into our financial statements as of December 31,
2014 and December 31, 2013. We have not provided
additional financial support to these entities which we are not
contractually required to provide.
Table 58: Consolidated VIEs – Carrying Value (a) (b)
December 31, 2014
In millions
Credit Card and Other
Securitization Trusts
Tax Credit
Investments Total
Assets
Cash and due from
banks $ 6 $ 6
Interest-earning
deposits with
banks 6 6
Loans $1,606 1,606
Allowance for loan
and lease losses (50) (50)
Equity investments 492 492
Other assets 31 452 483
Total assets $1,587 $956 $2,543
Liabilities
Other borrowed
funds $ 166 $181 $ 347
Accrued expenses 70 70
Other liabilities 206 206
Total liabilities $ 166 $457 $ 623
December 31, 2013
In millions
Credit Card and Other
Securitization Trusts
Tax Credit
Investments Total
Assets
Cash and due from
banks $ 5 $ 5
Interest-earning
deposits with
banks 7 7
Loans $1,736 1,736
Allowance for loan
and lease losses (58) (58)
Equity investments 582 582
Other assets 25 566 591
Total assets $1,703 $1,160 $2,863
Liabilities
Other borrowed
funds $ 184 $ 230 $ 414
Accrued expenses 83 83
Other liabilities 252 252
Total liabilities $ 184 $ 565 $ 749
(a) Amounts represent carrying value on PNC’s Consolidated Balance Sheet.
(b) Difference between total assets and total liabilities represents the equity portion of
the VIE or intercompany assets and liabilities which are eliminated in consolidation.
126 The PNC Financial Services Group, Inc. – Form 10-K