PNC Bank 2014 Annual Report Download - page 204
Download and view the complete annual report
Please find page 204 of the 2014 PNC Bank annual report below. You can navigate through the pages in the report by either clicking on the pages listed below, or by using the keyword search tool below to find specific information within the annual report.-
 1
1 -
2
-
3
-
4
-
5
-
6
-
7
-
8
-
9
-
10
-
11
-
12
-
13
-
14
-
15
-
16
-
17
-
18
-
19
-
20
-
21
-
22
-
23
-
24
-
25
-
26
-
27
-
28
-
29
-
30
-
31
-
32
-
33
-
34
-
35
-
36
-
37
-
38
-
39
-
40
-
41
-
42
-
43
-
44
-
45
-
46
-
47
-
48
-
49
-
50
-
51
-
52
-
53
-
54
-
55
-
56
-
57
-
58
-
59
-
60
-
61
-
62
-
63
-
64
-
65
-
66
-
67
-
68
-
69
-
70
-
71
-
72
-
73
-
74
-
75
-
76
-
77
-
78
-
79
-
80
-
81
-
82
-
83
-
84
-
85
-
86
-
87
-
88
-
89
-
90
-
91
-
92
-
93
-
94
-
95
-
96
-
97
-
98
-
99
-
100
-
101
-
102
-
103
-
104
-
105
-
106
-
107
-
108
-
109
-
110
-
111
-
112
-
113
-
114
-
115
-
116
-
117
-
118
-
119
-
120
-
121
-
122
-
123
-
124
-
125
-
126
-
127
-
128
-
129
-
130
-
131
-
132
-
133
-
134
-
135
-
136
-
137
-
138
-
139
-
140
-
141
-
142
-
143
-
144
-
145
-
146
-
147
-
148
-
149
-
150
-
151
-
152
-
153
-
154
-
155
-
156
-
157
-
158
-
159
-
160
-
161
-
162
-
163
-
164
-
165
-
166
-
167
-
168
-
169
-
170
-
171
-
172
-
173
-
174
-
175
-
176
-
177
-
178
-
179
-
180
-
181
-
182
-
183
-
184
-
185
-
186
-
187
-
188
-
189
-
190
-
191
-
192
-
193
-
 194
194 -
 195
195 -
 196
196 -
 197
197 -
 198
198 -
 199
199 -
 200
200 -
 201
201 -
 202
202 -
 203
203 -
 204
204 -
 205
205 -
 206
206 -
 207
207 -
 208
208 -
 209
209 -
 210
210 -
 211
211 -
 212
212 -
 213
213 -
 214
214 -
215
-
216
-
217
-
218
-
219
-
220
-
221
-
222
-
223
-
224
-
225
-
226
-
227
-
228
-
229
-
230
-
231
-
232
-
233
-
234
-
235
-
236
-
237
-
238
-
239
-
240
-
241
-
242
-
243
-
244
-
245
-
246
-
247
-
248
-
249
-
250
-
251
-
252
-
253
-
254
-
255
-
256
-
257
-
258
-
259
-
260
-
261
-
262
-
263
-
264
-
265
-
266
-
267
-
268
 |
 |

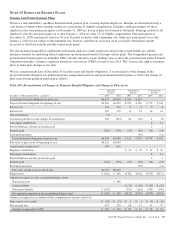
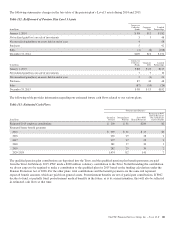
In the preceding table, the unit shares and related weighted-
average grant date fair value of the incentive/performance
awards exclude the effect of dividends on the underlying
shares, as those dividends will be paid in cash if and when the
underlying unit shares are released to the participants.
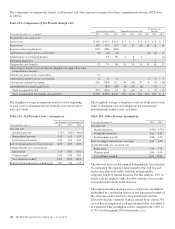
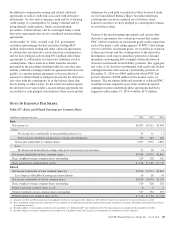
Liability Awards
A summary of all nonvested, cash-payable incentive/
performance units and restricted share unit activity follows:
Table 122: Nonvested Cash-Payable Incentive/Performance
Units and Restricted Share Units – Rollforward
In thousands
Cash-Payable
Incentive/
Performance
Units
Cash-Payable
Restricted
Share Units Total
Outstanding at December 31,
2013 116 825 941
Granted 100 269 369
Vested and Released (39) (425) (464)
Forfeited (11) (11)
Outstanding at December 31,
2014 177 658 835
Included in the preceding table are cash-payable restricted
share units granted to certain executives. These grants were
made primarily as part of an annual bonus incentive deferral
plan. While there are time-based and other vesting criteria,
there are generally no market or performance criteria
associated with these awards. Compensation expense
recognized related to these awards was recorded in prior
periods as part of the annual cash bonus process. As of
December 31, 2014, the aggregate intrinsic value of all
outstanding nonvested cash-payable incentive/performance
units and restricted share units was $76 million.
The total of all share-based liability awards paid out during
2014, 2013 and 2012 was approximately $38 million, $29
million and $39 million, respectively.
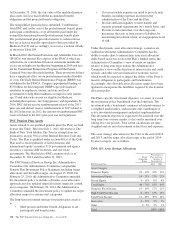
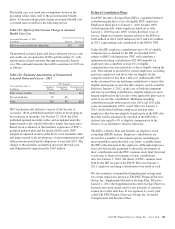
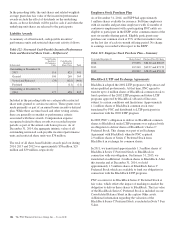
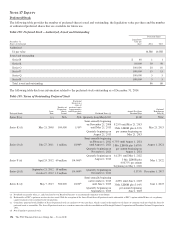
Employee Stock Purchase Plan
As of December 31, 2014, our ESPP had approximately
1 million shares available for issuance. Full-time employees
with six months and part-time employees with 12 months of
continuous employment with a participating PNC entity are
eligible to participate in the ESPP at the commencement of the
next six-month offering period. Eligible participants may
purchase our common stock at 95% of the fair market value
on the last day of each six-month offering period. No charge
to earnings is recorded with respect to the ESPP.
Table 123: Employee Stock Purchase Plan – Summary
Year ended December 31 Shares Issued Purchase Price Per Share
2014 157,856 $84.60 and $86.67
2013 167,260 $69.27 and $73.70
2012 183,892 $58.05 and $55.39
BlackRock LTIP and Exchange Agreements
BlackRock adopted the 2002 LTIP program to help attract and
retain qualified professionals. At that time, PNC agreed to
transfer up to 4 million shares of BlackRock common stock to
fund a portion of the 2002 LTIP program and future LTIP
programs approved by BlackRock’s Board of Directors,
subject to certain conditions and limitations. Approximately
1.1 million shares of BlackRock common stock were
transferred by PNC and distributed to LTIP participants in
connection with the 2002 LTIP program.
In 2009, PNC’s obligation to deliver its BlackRock common
shares to BlackRock under LTIP programs was replaced with
an obligation to deliver shares of BlackRock’s Series C
Preferred Stock. This change was part of an Exchange
Agreement with BlackRock whereby PNC acquired
2.9 million shares of Series C Preferred Stock from
BlackRock in exchange for common shares.
In 2011, we transferred approximately 1.3 million shares of
BlackRock Series C Preferred Stock to BlackRock in
connection with our obligation. On January 31, 2013, we
transferred an additional .2 million shares to BlackRock. After
this transfer and at December 31, 2014, we hold
approximately 1.3 million shares of BlackRock Series C
Preferred Stock which are available to fund our obligation in
connection with the BlackRock LTIP programs.
PNC accounts for its BlackRock Series C Preferred Stock at
fair value, which offsets the impact of marking-to-market the
obligation to deliver these shares to BlackRock. The fair value
of the BlackRock Series C Preferred Stock is included on our
Consolidated Balance Sheet in the caption Other assets.
Additional information regarding the valuation of the
BlackRock Series C Preferred Stock is included in Note 7 Fair
Value.
186 The PNC Financial Services Group, Inc. – Form 10-K