PNC Bank 2014 Annual Report Download - page 159
Download and view the complete annual report
Please find page 159 of the 2014 PNC Bank annual report below. You can navigate through the pages in the report by either clicking on the pages listed below, or by using the keyword search tool below to find specific information within the annual report.-
 1
1 -
2
-
3
-
4
-
5
-
6
-
7
-
8
-
9
-
10
-
11
-
12
-
13
-
14
-
15
-
16
-
17
-
18
-
19
-
20
-
21
-
22
-
23
-
24
-
25
-
26
-
27
-
28
-
29
-
30
-
31
-
32
-
33
-
34
-
35
-
36
-
37
-
38
-
39
-
40
-
41
-
42
-
43
-
44
-
45
-
46
-
47
-
48
-
49
-
50
-
51
-
52
-
53
-
54
-
55
-
56
-
57
-
58
-
59
-
60
-
61
-
62
-
63
-
64
-
65
-
66
-
67
-
68
-
69
-
70
-
71
-
72
-
73
-
74
-
75
-
76
-
77
-
78
-
79
-
80
-
81
-
82
-
83
-
84
-
85
-
86
-
87
-
88
-
89
-
90
-
91
-
92
-
93
-
94
-
95
-
96
-
97
-
98
-
99
-
100
-
101
-
102
-
103
-
104
-
105
-
106
-
107
-
108
-
109
-
110
-
111
-
112
-
113
-
114
-
115
-
116
-
117
-
118
-
119
-
120
-
121
-
122
-
123
-
124
-
125
-
126
-
127
-
128
-
129
-
130
-
131
-
132
-
133
-
134
-
135
-
136
-
137
-
138
-
139
-
140
-
141
-
142
-
143
-
144
-
145
-
146
-
147
-
148
-
 149
149 -
 150
150 -
 151
151 -
 152
152 -
 153
153 -
 154
154 -
 155
155 -
 156
156 -
 157
157 -
 158
158 -
 159
159 -
 160
160 -
 161
161 -
 162
162 -
 163
163 -
 164
164 -
 165
165 -
 166
166 -
 167
167 -
 168
168 -
 169
169 -
170
-
171
-
172
-
173
-
174
-
175
-
176
-
177
-
178
-
179
-
180
-
181
-
182
-
183
-
184
-
185
-
186
-
187
-
188
-
189
-
190
-
191
-
192
-
193
-
194
-
195
-
196
-
197
-
198
-
199
-
200
-
201
-
202
-
203
-
204
-
205
-
206
-
207
-
208
-
209
-
210
-
211
-
212
-
213
-
214
-
215
-
216
-
217
-
218
-
219
-
220
-
221
-
222
-
223
-
224
-
225
-
226
-
227
-
228
-
229
-
230
-
231
-
232
-
233
-
234
-
235
-
236
-
237
-
238
-
239
-
240
-
241
-
242
-
243
-
244
-
245
-
246
-
247
-
248
-
249
-
250
-
251
-
252
-
253
-
254
-
255
-
256
-
257
-
258
-
259
-
260
-
261
-
262
-
263
-
264
-
265
-
266
-
267
-
268
 |
 |

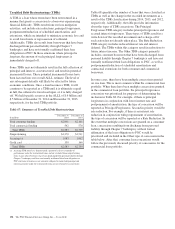
reaffirmed its loan obligation to PNC are charged off to collateral value less costs to sell, and any associated allowance at the time
of charge-off is reduced to zero.
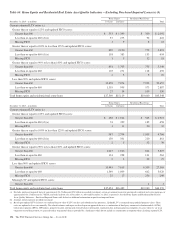
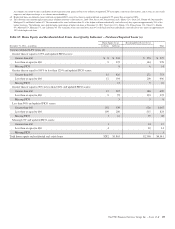
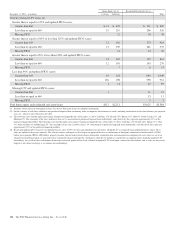
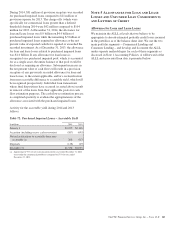
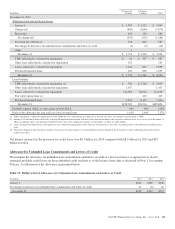
Impaired Loans
Impaired loans include commercial nonperforming loans and consumer and commercial TDRs, regardless of nonperforming status.
TDRs that were previously recorded at amortized cost and are now classified and accounted for as held for sale are also included.
Excluded from impaired loans are nonperforming leases, loans accounted for as held for sale other than the TDRs described in the
preceding sentence, loans accounted for under the fair value option, smaller balance homogeneous type loans and purchased
impaired loans. See Note 4 Purchased Loans for additional information. Nonperforming equipment lease financing loans of $2
million and $5 million at December 31, 2014 and December 31, 2013, respectively, are excluded from impaired loans pursuant to
authoritative lease accounting guidance. We did not recognize any interest income on impaired loans that have not returned to
performing status, while they were impaired during the years ended December 31, 2014 and December 31, 2013. The following
table provides further detail on impaired loans individually evaluated for impairment and the associated ALLL. Certain commercial
impaired loans and loans to consumers discharged from bankruptcy and not formally reaffirmed do not have a related ALLL as the
valuation of these impaired loans exceeded the recorded investment.
Table 70: Impaired Loans
In millions
Unpaid
Principal
Balance
Recorded
Investment (a)
Associated
Allowance (b)
Average
Recorded
Investment (c)
December 31, 2014
Impaired loans with an associated allowance
Commercial $ 432 $ 318 $ 74 $ 360
Commercial real estate 418 262 65 283
Home equity 1,021 984 215 986
Residential real estate 397 420 75 422
Credit card 130 130 32 147
Other consumer 64 47 2 51
Total impaired loans with an associated allowance $2,462 $2,161 $463 $2,249
Impaired loans without an associated allowance
Commercial $ 106 $ 84 $ $ 133
Commercial real estate 249 187 276
Home equity 403 145 134
Residential real estate 344 315 365
Total impaired loans without an associated allowance $1,102 $ 731 $ $ 908
Total impaired loans $3,564 $2,892 $463 $3,157
December 31, 2013
Impaired loans with an associated allowance
Commercial $ 549 $ 400 $ 90 $ 442
Commercial real estate 517 349 89 478
Home equity 999 992 334 900
Residential real estate 573 436 74 645
Credit card 166 166 36 189
Other consumer 71 57 2 68
Total impaired loans with an associated allowance $2,875 $2,400 $625 $2,722
Impaired loans without an associated allowance
Commercial $ 309 $ 163 $ $ 161
Commercial real estate 421 315 354
Home equity 366 124 166
Residential real estate 415 386 267
Total impaired loans without an associated allowance $1,511 $ 988 $ $ 948
Total impaired loans $4,386 $3,388 $625 $3,670
(a) Recorded investment in a loan includes the unpaid principal balance plus accrued interest and net accounting adjustments, less any charge-offs. Recorded investment does not include
any associated valuation allowance.
(b) Associated allowance amounts include $.4 billion and $.5 billion for TDRs at December 31, 2014 and December 31, 2013, respectively.
(c) Average recorded investment is for the years ended December 31, 2014 and December 31, 2013, respectively.
The PNC Financial Services Group, Inc. – Form 10-K 141