PNC Bank 2014 Annual Report Download - page 71
Download and view the complete annual report
Please find page 71 of the 2014 PNC Bank annual report below. You can navigate through the pages in the report by either clicking on the pages listed below, or by using the keyword search tool below to find specific information within the annual report.-
 1
1 -
2
-
3
-
4
-
5
-
6
-
7
-
8
-
9
-
10
-
11
-
12
-
13
-
14
-
15
-
16
-
17
-
18
-
19
-
20
-
21
-
22
-
23
-
24
-
25
-
26
-
27
-
28
-
29
-
30
-
31
-
32
-
33
-
34
-
35
-
36
-
37
-
38
-
39
-
40
-
41
-
42
-
43
-
44
-
45
-
46
-
47
-
48
-
49
-
50
-
51
-
52
-
53
-
54
-
55
-
56
-
57
-
58
-
59
-
60
-
 61
61 -
 62
62 -
 63
63 -
 64
64 -
 65
65 -
 66
66 -
 67
67 -
 68
68 -
 69
69 -
 70
70 -
 71
71 -
 72
72 -
 73
73 -
 74
74 -
 75
75 -
 76
76 -
 77
77 -
 78
78 -
 79
79 -
 80
80 -
 81
81 -
82
-
83
-
84
-
85
-
86
-
87
-
88
-
89
-
90
-
91
-
92
-
93
-
94
-
95
-
96
-
97
-
98
-
99
-
100
-
101
-
102
-
103
-
104
-
105
-
106
-
107
-
108
-
109
-
110
-
111
-
112
-
113
-
114
-
115
-
116
-
117
-
118
-
119
-
120
-
121
-
122
-
123
-
124
-
125
-
126
-
127
-
128
-
129
-
130
-
131
-
132
-
133
-
134
-
135
-
136
-
137
-
138
-
139
-
140
-
141
-
142
-
143
-
144
-
145
-
146
-
147
-
148
-
149
-
150
-
151
-
152
-
153
-
154
-
155
-
156
-
157
-
158
-
159
-
160
-
161
-
162
-
163
-
164
-
165
-
166
-
167
-
168
-
169
-
170
-
171
-
172
-
173
-
174
-
175
-
176
-
177
-
178
-
179
-
180
-
181
-
182
-
183
-
184
-
185
-
186
-
187
-
188
-
189
-
190
-
191
-
192
-
193
-
194
-
195
-
196
-
197
-
198
-
199
-
200
-
201
-
202
-
203
-
204
-
205
-
206
-
207
-
208
-
209
-
210
-
211
-
212
-
213
-
214
-
215
-
216
-
217
-
218
-
219
-
220
-
221
-
222
-
223
-
224
-
225
-
226
-
227
-
228
-
229
-
230
-
231
-
232
-
233
-
234
-
235
-
236
-
237
-
238
-
239
-
240
-
241
-
242
-
243
-
244
-
245
-
246
-
247
-
248
-
249
-
250
-
251
-
252
-
253
-
254
-
255
-
256
-
257
-
258
-
259
-
260
-
261
-
262
-
263
-
264
-
265
-
266
-
267
-
268
 |
 |
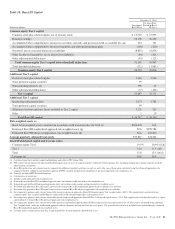
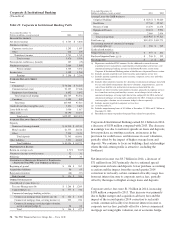
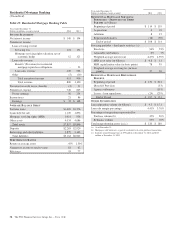
The provision for credit losses was $277 million and net
charge-offs were $458 million in 2014 compared with $657
million and $713 million, respectively, for 2013. Provision for
credit losses decreased due to improved credit metrics. The
decrease in the net charge-offs was attributable to the impact
of additional consumer charge-offs taken as a result of
alignment with interagency guidance in the first quarter of
2013 and improved credit quality during 2014.
Noninterest expense of $4.6 billion was $49 million, or 1%,
higher than 2013. Increases in technology investments,
customer transaction-related costs, and non-credit losses were
offset by reduced branch network expenses as a result of
transaction migration to lower cost digital and ATM channels.
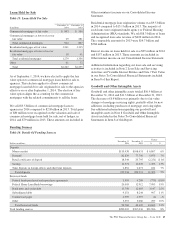
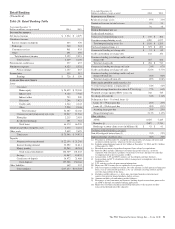
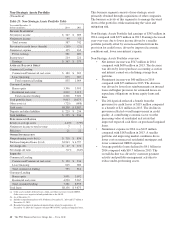
Growing core checking deposits is key to Retail Banking’s
growth and to providing a source of low-cost funding and
liquidity to PNC. The deposit product strategy of Retail Banking
is to remain disciplined on pricing, target specific products and
markets for growth, and focus on the retention and growth of
customer balances. In 2014, average total deposits of $137.2
billion increased $3.0 billion, or 2%, compared with 2013.
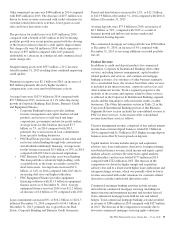
• Average transaction deposits grew $4.5 billion, or
4%, and average savings deposit balances grew $1.0
billion, or 9%, over 2013 as a result of organic
deposit growth. In 2014, average demand deposits
increased $3.1 billion, or 6%, to $56.1 billion and
average money market deposits increased $1.5
billion, or 3%, to $50.3 billion.
• Total average certificates of deposit decreased $2.5
billion, or 12%, compared to 2013. The decline in
average certificates of deposit was due to the
expected run-off of maturing accounts.
Retail Banking continued to focus on a relationship-based
lending strategy that targets specific products and markets for
growth, small businesses, and auto dealerships. In 2014,
average total loans declined $60 million to $66.2 billion as
growth in specific products was offset by declines from run-
off of non-strategic portions of the portfolios.
• Average indirect auto loans increased $1.4 billion, or
18%, compared to 2013. The increase was primarily
due to increases in auto sales as well as the expansion
of our indirect sales force and product introduction
into the Southeast market.
• Average credit card balances increased $222 million,
or 5%, over 2013 as a result of efforts to increase
credit card share of wallet through organic growth.
• Average auto dealer floor plan loans grew $160
million, or 8%, in 2014, primarily resulting from
sales growth and additional dealer relationships.
• Average home equity loans decreased $448 million
compared to 2013. The decrease in lines of credit of
approximately $1.0 billion was partially offset by an
increase of approximately $600 million in term loans.
The overall portfolio declines resulted from reduced
refinance activity. Retail Banking’s home equity loan
portfolio is relationship based, with 97% of the
portfolio attributable to borrowers in our primary
geographic footprint.
• Average loan balances for the remainder of the
portfolio declined a net $1.4 billion, driven by
declines in the education portfolio of $715 million
and commercial & commercial real estate of $399
million. The discontinued government guaranteed
education loan, indirect other and residential
mortgage portfolios are primarily run-off portfolios.
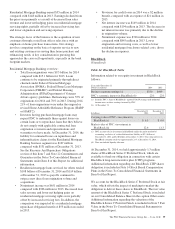
In December 2014 we sold $148 million of education
loans. The impacts of the sale to 2014 average loans
and earnings were not significant.
Nonperforming assets totaled $1.2 billion at December 31,
2014, a decrease of $87 million, or 7%, over 2013. The
decrease was driven by declines in both commercial and
consumer non-performing loans.
The PNC Financial Services Group, Inc. – Form 10-K 53