PNC Bank 2014 Annual Report Download - page 52
Download and view the complete annual report
Please find page 52 of the 2014 PNC Bank annual report below. You can navigate through the pages in the report by either clicking on the pages listed below, or by using the keyword search tool below to find specific information within the annual report.-
 1
1 -
2
-
3
-
4
-
5
-
6
-
7
-
8
-
9
-
10
-
11
-
12
-
13
-
14
-
15
-
16
-
17
-
18
-
19
-
20
-
21
-
22
-
23
-
24
-
25
-
26
-
27
-
28
-
29
-
30
-
31
-
32
-
33
-
34
-
35
-
36
-
37
-
38
-
39
-
40
-
41
-
 42
42 -
 43
43 -
 44
44 -
 45
45 -
 46
46 -
 47
47 -
 48
48 -
 49
49 -
 50
50 -
 51
51 -
 52
52 -
 53
53 -
 54
54 -
 55
55 -
 56
56 -
 57
57 -
 58
58 -
 59
59 -
 60
60 -
 61
61 -
 62
62 -
63
-
64
-
65
-
66
-
67
-
68
-
69
-
70
-
71
-
72
-
73
-
74
-
75
-
76
-
77
-
78
-
79
-
80
-
81
-
82
-
83
-
84
-
85
-
86
-
87
-
88
-
89
-
90
-
91
-
92
-
93
-
94
-
95
-
96
-
97
-
98
-
99
-
100
-
101
-
102
-
103
-
104
-
105
-
106
-
107
-
108
-
109
-
110
-
111
-
112
-
113
-
114
-
115
-
116
-
117
-
118
-
119
-
120
-
121
-
122
-
123
-
124
-
125
-
126
-
127
-
128
-
129
-
130
-
131
-
132
-
133
-
134
-
135
-
136
-
137
-
138
-
139
-
140
-
141
-
142
-
143
-
144
-
145
-
146
-
147
-
148
-
149
-
150
-
151
-
152
-
153
-
154
-
155
-
156
-
157
-
158
-
159
-
160
-
161
-
162
-
163
-
164
-
165
-
166
-
167
-
168
-
169
-
170
-
171
-
172
-
173
-
174
-
175
-
176
-
177
-
178
-
179
-
180
-
181
-
182
-
183
-
184
-
185
-
186
-
187
-
188
-
189
-
190
-
191
-
192
-
193
-
194
-
195
-
196
-
197
-
198
-
199
-
200
-
201
-
202
-
203
-
204
-
205
-
206
-
207
-
208
-
209
-
210
-
211
-
212
-
213
-
214
-
215
-
216
-
217
-
218
-
219
-
220
-
221
-
222
-
223
-
224
-
225
-
226
-
227
-
228
-
229
-
230
-
231
-
232
-
233
-
234
-
235
-
236
-
237
-
238
-
239
-
240
-
241
-
242
-
243
-
244
-
245
-
246
-
247
-
248
-
249
-
250
-
251
-
252
-
253
-
254
-
255
-
256
-
257
-
258
-
259
-
260
-
261
-
262
-
263
-
264
-
265
-
266
-
267
-
268
 |
 |

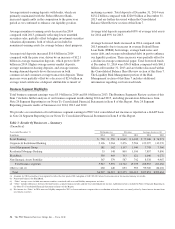
• Noninterest income was $6.9 billion for 2014 and
2013, as strong overall client fee income was offset
by lower residential mortgage revenue, declines in
asset valuations and reduced sales of securities.
• The provision for credit losses decreased to $273
million for 2014 compared to $643 million for 2013
due to overall credit quality improvement.
• Noninterest expense was $9.5 billion for 2014, a
decrease of 2% compared with 2013, primarily
reflecting well managed expenses.
Credit Quality Highlights
• Asset quality trends in 2014 improved from 2013.
For additional detail, see the Credit Risk
Management portion of the Risk Management section
of this Item 7.
• Nonperforming assets decreased $.6 billion, or 17%,
to $2.9 billion at December 31, 2014 compared to
December 31, 2013. Nonperforming assets to total
assets were 0.83% at December 31, 2014, compared
to 1.08% at December 31, 2013.
• Overall loan delinquencies of $1.9 billion at
December 31, 2014 decreased $.5 billion, or 22%,
compared with December 31, 2013.
• The allowance for loan and lease losses was 1.63% of
total loans and 133% of nonperforming loans at
December 31, 2014, compared with 1.84% and 117%
at December 31, 2013, respectively.
• Net charge-offs of $.5 billion in 2014 declined 51%
compared to net charge-offs of $1.1 billion for 2013.
Net charge-offs were 0.27% of average loans in 2014
and 0.57% of average loans in 2013. These
comparisons were impacted by alignment with
interagency guidance in the first quarter of 2013 on
practices for loans and lines of credit related to
consumer lending. In the first quarter 2013, this
alignment had the overall effect of (i) accelerating
charge-offs, (ii) increasing nonperforming loans and
(iii) in the case of loans accounted for under the fair
value option, increasing nonaccrual loans.
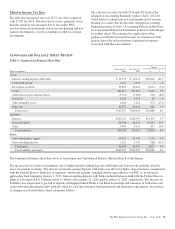
Balance Sheet Highlights
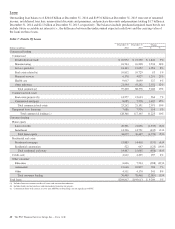
• Total loans increased by $9.2 billion to $205 billion
at December 31, 2014 compared to December 31,
2013.
• Total commercial lending increased by $11.2
billion, or 10%, as a result of growth in
commercial and commercial real estate loans.
• Total consumer lending decreased $2.0 billion,
or 3%, due to lower home equity, education
and residential mortgage loans, partially offset
by growth in automobile loans.
• Total deposits increased by $11.3 billion, or 5%, to
$232 billion at December 31, 2014 compared with
December 31, 2013, driven by growth in transaction
deposits.
• PNC further increased its liquidity position as
reflected in higher deposit balances maintained with
the Federal Reserve Bank.
• The regulatory short-term Liquidity Coverage
Ratio became effective for PNC as an advanced
approaches bank beginning January 1, 2015,
with a minimum phased-in requirement of 80%
in 2015, calculated as of month end. The
estimated pro forma ratio at December 31,
2014 exceeded 100% and 95% for PNC and
PNC Bank, respectively.
• PNC’s well-positioned balance sheet remained core
funded with a loans to deposits ratio of 88% at
December 31, 2014.
• The Transitional Basel III common equity Tier 1
capital ratio, calculated using the regulatory capital
methodology applicable to PNC during 2014, was
10.9% at December 31, 2014.
• Pro forma fully phased-in Basel III common equity
Tier 1 capital ratio increased to an estimated 10.0% at
December 31, 2014 from 9.4% at December 31, 2013
based on the standardized approach rules. See the
Capital discussion and Table 18 in the Consolidated
Balance Sheet Review section of this Item 7 and the
December 31, 2013 capital ratio tables in the
Statistical Information (Unaudited) section in Item 8
of this Report for more detail.
Our Consolidated Income Statement and Consolidated
Balance Sheet Review sections of this Item 7 describe in
greater detail the various items that impacted our results
during 2014 and 2013 and balances at December 31, 2014 and
December 31, 2013, respectively.
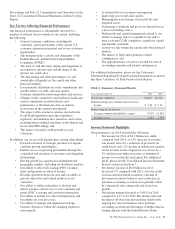
Capital and Liquidity Actions
Our ability to take certain capital actions, including plans to
pay or increase common stock dividends or to repurchase
shares under current or future programs, is subject to the
results of the supervisory assessment of capital adequacy
undertaken by the Federal Reserve and our primary bank
regulators as part of the CCAR process.
In connection with the 2014 CCAR, PNC submitted its 2014
capital plan, as approved by its Board of Directors, to the
Federal Reserve in January 2014. As we announced on
March 26, 2014, the Federal Reserve accepted the capital plan
and did not object to our proposed capital actions, which
included a recommendation to increase the quarterly common
stock dividend in the second quarter of 2014. The capital plan
also included share repurchase programs of up to $1.5 billion
for the four quarter period beginning in the second quarter of
2014 under PNC’s existing common stock repurchase
authorization. These programs include repurchases of up to
$200 million to mitigate the financial impact of employee
benefit plan transactions. In the last three quarters of 2014, in
34 The PNC Financial Services Group, Inc. – Form 10-K