PNC Bank 2014 Annual Report Download - page 176
Download and view the complete annual report
Please find page 176 of the 2014 PNC Bank annual report below. You can navigate through the pages in the report by either clicking on the pages listed below, or by using the keyword search tool below to find specific information within the annual report.-
 1
1 -
2
-
3
-
4
-
5
-
6
-
7
-
8
-
9
-
10
-
11
-
12
-
13
-
14
-
15
-
16
-
17
-
18
-
19
-
20
-
21
-
22
-
23
-
24
-
25
-
26
-
27
-
28
-
29
-
30
-
31
-
32
-
33
-
34
-
35
-
36
-
37
-
38
-
39
-
40
-
41
-
42
-
43
-
44
-
45
-
46
-
47
-
48
-
49
-
50
-
51
-
52
-
53
-
54
-
55
-
56
-
57
-
58
-
59
-
60
-
61
-
62
-
63
-
64
-
65
-
66
-
67
-
68
-
69
-
70
-
71
-
72
-
73
-
74
-
75
-
76
-
77
-
78
-
79
-
80
-
81
-
82
-
83
-
84
-
85
-
86
-
87
-
88
-
89
-
90
-
91
-
92
-
93
-
94
-
95
-
96
-
97
-
98
-
99
-
100
-
101
-
102
-
103
-
104
-
105
-
106
-
107
-
108
-
109
-
110
-
111
-
112
-
113
-
114
-
115
-
116
-
117
-
118
-
119
-
120
-
121
-
122
-
123
-
124
-
125
-
126
-
127
-
128
-
129
-
130
-
131
-
132
-
133
-
134
-
135
-
136
-
137
-
138
-
139
-
140
-
141
-
142
-
143
-
144
-
145
-
146
-
147
-
148
-
149
-
150
-
151
-
152
-
153
-
154
-
155
-
156
-
157
-
158
-
159
-
160
-
161
-
162
-
163
-
164
-
165
-
 166
166 -
 167
167 -
 168
168 -
 169
169 -
 170
170 -
 171
171 -
 172
172 -
 173
173 -
 174
174 -
 175
175 -
 176
176 -
 177
177 -
 178
178 -
 179
179 -
 180
180 -
 181
181 -
 182
182 -
 183
183 -
 184
184 -
 185
185 -
 186
186 -
187
-
188
-
189
-
190
-
191
-
192
-
193
-
194
-
195
-
196
-
197
-
198
-
199
-
200
-
201
-
202
-
203
-
204
-
205
-
206
-
207
-
208
-
209
-
210
-
211
-
212
-
213
-
214
-
215
-
216
-
217
-
218
-
219
-
220
-
221
-
222
-
223
-
224
-
225
-
226
-
227
-
228
-
229
-
230
-
231
-
232
-
233
-
234
-
235
-
236
-
237
-
238
-
239
-
240
-
241
-
242
-
243
-
244
-
245
-
246
-
247
-
248
-
249
-
250
-
251
-
252
-
253
-
254
-
255
-
256
-
257
-
258
-
259
-
260
-
261
-
262
-
263
-
264
-
265
-
266
-
267
-
268
 |
 |
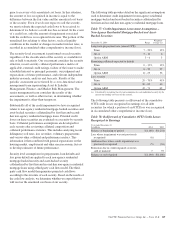
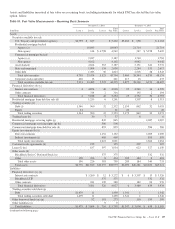
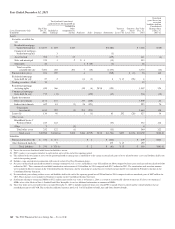
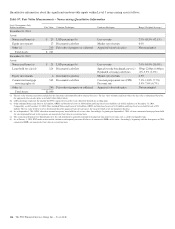
(a) In our third quarter 2014 10-Q, these line items were corrected as of December 31, 2013 due to a misclassification of Government National Mortgage Association (GNMA) securities
collateralized by project loans. $1.1 billion was previously reported as residential mortgage-backed agency securities and was reclassified to commercial mortgage-backed agency
securities.
(b) Included in Other assets on our Consolidated Balance Sheet.
(c) Amounts at December 31, 2014 and December 31, 2013 are presented gross and are not reduced by the impact of legally enforceable master netting agreements that allow PNC to net
positive and negative positions and cash collateral held or placed with the same counterparty. The net asset amounts were $2.6 billion at December 31, 2014 and $1.7 billion at
December 31, 2013, and the net liability amounts were $1.4 billion and $.9 billion, respectively.
(d) Included in Loans held for sale on our Consolidated Balance Sheet. PNC has elected the fair value option for certain residential and commercial mortgage loans held for sale.
(e) Fair value includes net unrealized gains of $54 million at December 31, 2014 compared with net unrealized gains of $11 million at December 31, 2013.
(f) Approximately 34% of these securities are residential mortgage-backed securities and 57% are U.S. Treasury and government agencies securities at December 31, 2014. Comparable
amounts at December 31, 2013 were 17% and 69%, respectively.
(g) Included in Other intangible assets on our Consolidated Balance Sheet.
(h) As of January 1, 2014, PNC made an irrevocable election to subsequently measure all classes of commercial MSRs at fair value. Accordingly, beginning with the first quarter of 2014,
commercial MSRs are measured at fair value on a recurring basis.
(i) Our adoption of ASU 2013-08, Financial Services – Investment Companies (Topic 946): Amendments to the Scope, Measurement and Disclosure Requirements, did not result in a
change in classification or status of our accounting for investment companies.
(j) The indirect equity funds are not redeemable, but PNC receives distributions over the life of the partnership from liquidation of the underlying investments by the investee, which we
expect to occur over the next twelve years. The amount of unfunded contractual commitments as of December 31, 2014 related to indirect equity investments was $112 million and
related to direct equity investments was $28 million, respectively. Comparable amounts at December 31, 2013 were $128 million and $36 million, respectively.
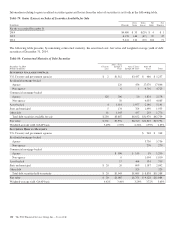
(k) Included in Federal funds sold and resale agreements on our Consolidated Balance Sheet. PNC has elected the fair value option for these items.
(l) Included in Loans on our Consolidated Balance Sheet.
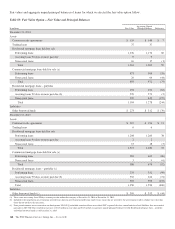
(m) In our third quarter 2014 10-Q, these line items were corrected as of December 31, 2013 to include transferred loans over which PNC regained effective control and the related
liabilities that are recorded pursuant to ASC 860. This resulted in a $125 million increase of both Loans and Other borrowed funds as of December 31, 2013.
(n) PNC has elected the fair value option for these shares.
(o) Included in Other liabilities on our Consolidated Balance Sheet.
(p) Included in Other borrowed funds on our Consolidated Balance Sheet.
158 The PNC Financial Services Group, Inc. – Form 10-K