PNC Bank 2014 Annual Report Download - page 190
Download and view the complete annual report
Please find page 190 of the 2014 PNC Bank annual report below. You can navigate through the pages in the report by either clicking on the pages listed below, or by using the keyword search tool below to find specific information within the annual report.-
 1
1 -
2
-
3
-
4
-
5
-
6
-
7
-
8
-
9
-
10
-
11
-
12
-
13
-
14
-
15
-
16
-
17
-
18
-
19
-
20
-
21
-
22
-
23
-
24
-
25
-
26
-
27
-
28
-
29
-
30
-
31
-
32
-
33
-
34
-
35
-
36
-
37
-
38
-
39
-
40
-
41
-
42
-
43
-
44
-
45
-
46
-
47
-
48
-
49
-
50
-
51
-
52
-
53
-
54
-
55
-
56
-
57
-
58
-
59
-
60
-
61
-
62
-
63
-
64
-
65
-
66
-
67
-
68
-
69
-
70
-
71
-
72
-
73
-
74
-
75
-
76
-
77
-
78
-
79
-
80
-
81
-
82
-
83
-
84
-
85
-
86
-
87
-
88
-
89
-
90
-
91
-
92
-
93
-
94
-
95
-
96
-
97
-
98
-
99
-
100
-
101
-
102
-
103
-
104
-
105
-
106
-
107
-
108
-
109
-
110
-
111
-
112
-
113
-
114
-
115
-
116
-
117
-
118
-
119
-
120
-
121
-
122
-
123
-
124
-
125
-
126
-
127
-
128
-
129
-
130
-
131
-
132
-
133
-
134
-
135
-
136
-
137
-
138
-
139
-
140
-
141
-
142
-
143
-
144
-
145
-
146
-
147
-
148
-
149
-
150
-
151
-
152
-
153
-
154
-
155
-
156
-
157
-
158
-
159
-
160
-
161
-
162
-
163
-
164
-
165
-
166
-
167
-
168
-
169
-
170
-
171
-
172
-
173
-
174
-
175
-
176
-
177
-
178
-
179
-
 180
180 -
 181
181 -
 182
182 -
 183
183 -
 184
184 -
 185
185 -
 186
186 -
 187
187 -
 188
188 -
 189
189 -
 190
190 -
 191
191 -
 192
192 -
 193
193 -
 194
194 -
 195
195 -
 196
196 -
 197
197 -
 198
198 -
 199
199 -
 200
200 -
201
-
202
-
203
-
204
-
205
-
206
-
207
-
208
-
209
-
210
-
211
-
212
-
213
-
214
-
215
-
216
-
217
-
218
-
219
-
220
-
221
-
222
-
223
-
224
-
225
-
226
-
227
-
228
-
229
-
230
-
231
-
232
-
233
-
234
-
235
-
236
-
237
-
238
-
239
-
240
-
241
-
242
-
243
-
244
-
245
-
246
-
247
-
248
-
249
-
250
-
251
-
252
-
253
-
254
-
255
-
256
-
257
-
258
-
259
-
260
-
261
-
262
-
263
-
264
-
265
-
266
-
267
-
268
 |
 |

reclassified to the gross carrying amount of commercial
MSRs. We recognize gains/(losses) on changes in the fair
value of commercial MSRs as a result of the election.
Commercial MSRs are subject to declines in value from actual
or expected prepayment of the underlying loans and also from
defaults. We manage this risk by economically hedging the
fair value of commercial MSRs with securities and derivative
instruments which are expected to increase (or decrease) in
value when the value of commercial MSRs declines (or
increases).
The fair value of commercial MSRs is estimated by using a
discounted cash flow model incorporating inputs for
assumptions as to constant prepayment rates, discount rates
and other factors determined based on current market
conditions and expectations.
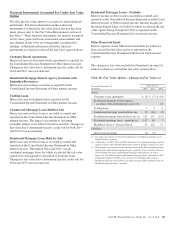
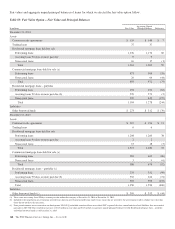
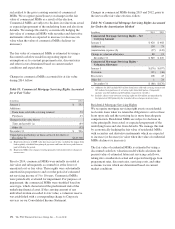
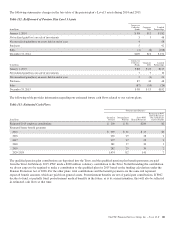
Changes in commercial MSRs accounted for at fair value
during 2014 follow:
Table 95: Commercial Mortgage Servicing Rights Accounted
for at Fair Value
In millions 2014
January 1 $ 552
Additions:
From loans sold with servicing retained 53
Purchases 43
Changes in fair value due to:
Time and payoffs (a) (89)
Other (b) (53)
December 31 $ 506
Unpaid principal balance of loans serviced for others at
December 31 $143,738
(a) Represents decrease in MSR value due to passage of time, including the impact from
both regularly scheduled loan principal payments and loans that were paid down or
paid off during the period.
(b) Represents MSR value changes resulting primarily from market-driven changes in
interest rates.
Prior to 2014, commercial MSRs were initially recorded at
fair value and subsequently accounted for at the lower of
amortized cost or fair value. These rights were substantially
amortized in proportion to and over the period of estimated
net servicing income of 5 to 10 years. Commercial MSRs
were periodically evaluated for impairment. For purposes of
impairment, the commercial MSRs were stratified based on
asset type, which characterized the predominant risk of the
underlying financial asset. If the carrying amount of any
individual stratum exceeded its fair value, a valuation reserve
was established with a corresponding charge to Corporate
services on our Consolidated Income Statement.
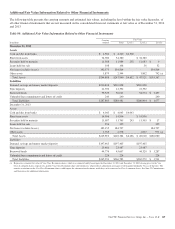
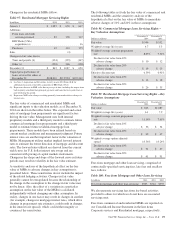
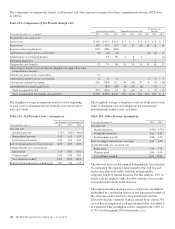
Changes in commercial MSRs during 2013 and 2012, prior to
the irrevocable fair value election, follow:
Table 96: Commercial Mortgage Servicing Rights Accounted
for Under the Amortization Method
In millions 2013 2012
Commercial Mortgage Servicing Rights – Net
Carrying Amount
January 1 $ 420 $ 468
Additions (a) 138 73
Amortization expense (b) (97) (142)
Change in valuation allowance 88 21
December 31 $ 549 $ 420
Commercial Mortgage Servicing Rights –
Valuation Allowance
January 1 $(176) $(197)
Provision (21) (46)
Recoveries 108 43
Other (b) 1 24
December 31 $ (88) $(176)
(a) Additions for 2013 included $53 million from loans sold with servicing retained and
$85 million from purchases of servicing rights from third parties. Comparable
amounts were $45 million and $28 million, respectively, for 2012.
(b) Includes a direct write-down of servicing rights for $24 million recognized in the
first quarter of 2012 primarily due to market-driven changes in interest rates.
Residential Mortgage Servicing Rights
We recognize mortgage servicing right assets on residential
real estate loans when we retain the obligation to service these
loans upon sale and the servicing fee is more than adequate
compensation. Residential MSRs are subject to declines in
value principally from actual or expected prepayment of the
underlying loans and also from defaults. We manage this risk
by economically hedging the fair value of residential MSRs
with securities and derivative instruments which are expected
to increase (or decrease) in value when the value of residential
MSRs declines (or increases).
The fair value of residential MSRs is estimated by using a
discounted cash flow valuation model which calculates the
present value of estimated future net servicing cash flows,
taking into consideration actual and expected mortgage loan
prepayment rates, discount rates, servicing costs, and other
economic factors which are determined based on current
market conditions.
172 The PNC Financial Services Group, Inc. – Form 10-K