PNC Bank 2014 Annual Report Download - page 53
Download and view the complete annual report
Please find page 53 of the 2014 PNC Bank annual report below. You can navigate through the pages in the report by either clicking on the pages listed below, or by using the keyword search tool below to find specific information within the annual report.-
 1
1 -
2
-
3
-
4
-
5
-
6
-
7
-
8
-
9
-
10
-
11
-
12
-
13
-
14
-
15
-
16
-
17
-
18
-
19
-
20
-
21
-
22
-
23
-
24
-
25
-
26
-
27
-
28
-
29
-
30
-
31
-
32
-
33
-
34
-
35
-
36
-
37
-
38
-
39
-
40
-
41
-
42
-
 43
43 -
 44
44 -
 45
45 -
 46
46 -
 47
47 -
 48
48 -
 49
49 -
 50
50 -
 51
51 -
 52
52 -
 53
53 -
 54
54 -
 55
55 -
 56
56 -
 57
57 -
 58
58 -
 59
59 -
 60
60 -
 61
61 -
 62
62 -
 63
63 -
64
-
65
-
66
-
67
-
68
-
69
-
70
-
71
-
72
-
73
-
74
-
75
-
76
-
77
-
78
-
79
-
80
-
81
-
82
-
83
-
84
-
85
-
86
-
87
-
88
-
89
-
90
-
91
-
92
-
93
-
94
-
95
-
96
-
97
-
98
-
99
-
100
-
101
-
102
-
103
-
104
-
105
-
106
-
107
-
108
-
109
-
110
-
111
-
112
-
113
-
114
-
115
-
116
-
117
-
118
-
119
-
120
-
121
-
122
-
123
-
124
-
125
-
126
-
127
-
128
-
129
-
130
-
131
-
132
-
133
-
134
-
135
-
136
-
137
-
138
-
139
-
140
-
141
-
142
-
143
-
144
-
145
-
146
-
147
-
148
-
149
-
150
-
151
-
152
-
153
-
154
-
155
-
156
-
157
-
158
-
159
-
160
-
161
-
162
-
163
-
164
-
165
-
166
-
167
-
168
-
169
-
170
-
171
-
172
-
173
-
174
-
175
-
176
-
177
-
178
-
179
-
180
-
181
-
182
-
183
-
184
-
185
-
186
-
187
-
188
-
189
-
190
-
191
-
192
-
193
-
194
-
195
-
196
-
197
-
198
-
199
-
200
-
201
-
202
-
203
-
204
-
205
-
206
-
207
-
208
-
209
-
210
-
211
-
212
-
213
-
214
-
215
-
216
-
217
-
218
-
219
-
220
-
221
-
222
-
223
-
224
-
225
-
226
-
227
-
228
-
229
-
230
-
231
-
232
-
233
-
234
-
235
-
236
-
237
-
238
-
239
-
240
-
241
-
242
-
243
-
244
-
245
-
246
-
247
-
248
-
249
-
250
-
251
-
252
-
253
-
254
-
255
-
256
-
257
-
258
-
259
-
260
-
261
-
262
-
263
-
264
-
265
-
266
-
267
-
268
 |
 |

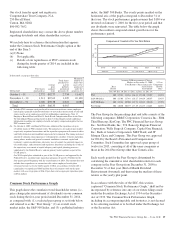
accordance with the 2014 capital plan, we repurchased
12.9 million shares of common stock on the open market, with
an average price of $85.95 per share and an aggregate
repurchase price of $1.1 billion.
On April 3, 2014, consistent with our 2014 capital plan, our
Board of Directors approved an increase to PNC’s quarterly
common stock dividend from 44 cents per common share to
48 cents per common share beginning with the May 5, 2014
dividend payment.
In connection with the 2015 CCAR, PNC submitted its 2015
capital plan, as approved by its Board of Directors, to the
Federal Reserve in January 2015. PNC expects to receive the
Federal Reserve’s response (either a non-objection or
objection) to the capital plan submitted as part of the 2015
CCAR in March 2015. For additional information concerning
the CCAR process and the factors the Federal Reserve takes
into consideration in evaluating capital plans, see the
Supervision and Regulation section of Item 1 of this Report.
See the Liquidity Risk Management portion of the Risk
Management section of this Item 7 for more detail on our
2014 capital and liquidity actions.
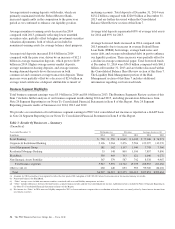
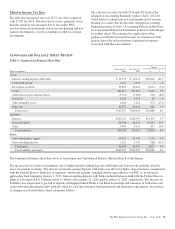
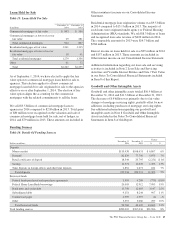
Average Consolidated Balance Sheet Highlights
Table 2: Summarized Average Balance Sheet
Year ended December 31 Change
Dollars in millions 2014 2013 $ %
Average assets
Interest-earning assets
Investment securities $ 55,820 $ 57,319 $ (1,499) (3)%
Loans 199,648 189,973 9,675 5%
Interest-earning deposits with banks 19,204 4,910 14,294 291%
Other 8,633 8,443 190 2%
Total interest-earning assets 283,305 260,645 22,660 9%
Noninterest-earning assets 44,548 45,019 (471) (1)%
Total average assets $327,853 $305,664 $22,189 7%
Average liabilities and equity
Interest-bearing liabilities
Interest-bearing deposits $152,814 $146,000 $ 6,814 5%
Borrowed funds 48,817 40,022 8,795 22%
Total interest-bearing liabilities 201,631 186,022 15,609 8%
Noninterest-bearing deposits 70,108 66,168 3,940 6%
Other liabilities 10,768 11,159 (391) (4)%
Equity 45,346 42,315 3,031 7%
Total average liabilities and equity $327,853 $305,664 $22,189 7%
Total assets were $345.1 billion at December 31, 2014
compared with $320.2 billion at December 31, 2013. The
increase from year end 2013 was primarily due to higher
interest-earning deposits with banks and loan growth, partially
offset by lower investment securities.
Various seasonal and other factors impact our period-end
balances, whereas average balances are generally more
indicative of underlying business trends apart from the impact
of acquisitions and divestitures. The Consolidated Balance
Sheet Review section of this Item 7 provides information on
changes in selected Consolidated Balance Sheet categories at
December 31, 2014 compared with December 31, 2013.
Average investment securities decreased during 2014
compared with 2013, primarily due to a net decline in average
residential and commercial mortgage-backed securities from
principal payments, partially offset by an increase in average
U.S. Treasury and government agencies securities, which was
largely driven by purchases to enhance our liquidity position.
Total investment securities comprised 20% of average
interest-earning assets in 2014 and 22% in 2013.
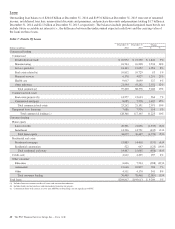
Average loans grew in 2014, driven by increases in average
commercial loans of $6.4 billion and average commercial real
estate loans of $3.2 billion. The overall increase in loans
reflected organic loan growth, primarily in our Corporate &
Institutional Banking segment.
Loans represented 70% of average interest-earning assets for
2014 and 73% of average interest-earning assets for 2013.
The PNC Financial Services Group, Inc. – Form 10-K 35