PNC Bank 2014 Annual Report Download - page 178
Download and view the complete annual report
Please find page 178 of the 2014 PNC Bank annual report below. You can navigate through the pages in the report by either clicking on the pages listed below, or by using the keyword search tool below to find specific information within the annual report.-
 1
1 -
2
-
3
-
4
-
5
-
6
-
7
-
8
-
9
-
10
-
11
-
12
-
13
-
14
-
15
-
16
-
17
-
18
-
19
-
20
-
21
-
22
-
23
-
24
-
25
-
26
-
27
-
28
-
29
-
30
-
31
-
32
-
33
-
34
-
35
-
36
-
37
-
38
-
39
-
40
-
41
-
42
-
43
-
44
-
45
-
46
-
47
-
48
-
49
-
50
-
51
-
52
-
53
-
54
-
55
-
56
-
57
-
58
-
59
-
60
-
61
-
62
-
63
-
64
-
65
-
66
-
67
-
68
-
69
-
70
-
71
-
72
-
73
-
74
-
75
-
76
-
77
-
78
-
79
-
80
-
81
-
82
-
83
-
84
-
85
-
86
-
87
-
88
-
89
-
90
-
91
-
92
-
93
-
94
-
95
-
96
-
97
-
98
-
99
-
100
-
101
-
102
-
103
-
104
-
105
-
106
-
107
-
108
-
109
-
110
-
111
-
112
-
113
-
114
-
115
-
116
-
117
-
118
-
119
-
120
-
121
-
122
-
123
-
124
-
125
-
126
-
127
-
128
-
129
-
130
-
131
-
132
-
133
-
134
-
135
-
136
-
137
-
138
-
139
-
140
-
141
-
142
-
143
-
144
-
145
-
146
-
147
-
148
-
149
-
150
-
151
-
152
-
153
-
154
-
155
-
156
-
157
-
158
-
159
-
160
-
161
-
162
-
163
-
164
-
165
-
166
-
167
-
 168
168 -
 169
169 -
 170
170 -
 171
171 -
 172
172 -
 173
173 -
 174
174 -
 175
175 -
 176
176 -
 177
177 -
 178
178 -
 179
179 -
 180
180 -
 181
181 -
 182
182 -
 183
183 -
 184
184 -
 185
185 -
 186
186 -
 187
187 -
 188
188 -
189
-
190
-
191
-
192
-
193
-
194
-
195
-
196
-
197
-
198
-
199
-
200
-
201
-
202
-
203
-
204
-
205
-
206
-
207
-
208
-
209
-
210
-
211
-
212
-
213
-
214
-
215
-
216
-
217
-
218
-
219
-
220
-
221
-
222
-
223
-
224
-
225
-
226
-
227
-
228
-
229
-
230
-
231
-
232
-
233
-
234
-
235
-
236
-
237
-
238
-
239
-
240
-
241
-
242
-
243
-
244
-
245
-
246
-
247
-
248
-
249
-
250
-
251
-
252
-
253
-
254
-
255
-
256
-
257
-
258
-
259
-
260
-
261
-
262
-
263
-
264
-
265
-
266
-
267
-
268
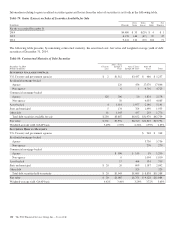
 |
 |

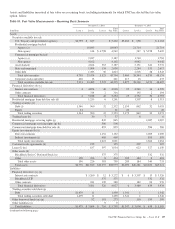
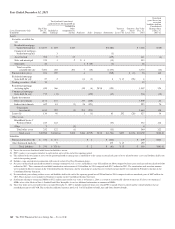
Year Ended December 31, 2013
Total realized / unrealized
gains or losses for the period (a)
Unrealized
gains (losses) on
assets and
liabilities held on
Consolidated
Balance Sheet
at Dec. 31,
2013 (c)
Level 3 Instruments Only
In millions
Fair Value
Dec. 31,
2012
Included in
Earnings
Included in
Other
comprehensive
income Purchases Sales Issuances Settlements
Transfers
into
Level 3 (b)
Transfers
out of
Level 3 (b)
Fair Value
Dec. 31,
2013
Assets
Securities available for
sale
Residential mortgage-
backed non-agency $ 6,107 $ 189 $147 $(1,085) $ 5,358 $ (10)
Commercial mortgage-
backed non-agency 3 (3)
Asset-backed 708 9 53 (129) 641 (6)
State and municipal 339 1 2 $ 4 (13) 333
Other debt 48 3 $ (10) (3) 38
Total securities
available for sale 7,202 202 202 7 (10) (1,233) 6,370 (16)
Financial derivatives 106 297 4 (369) $ (2) 36 166
Residential mortgage
loans held for sale 27 2 61 (3) 4 $ 13 (96) 8 2
Trading securities – Debt 32 32
Residential mortgage
servicing rights 650 366 110 (4) $158 (193) 1,087 354
Commercial mortgage
loans held for sale 772 (11) (130) (45) 586 (12)
Equity investments
Direct investments 1,171 141 177 (420) 1,069 62
Indirect investments 642 81 (3) 26 (151) 595 76
Total equity
investments 1,813 222 (3) 203 (571) 1,664 138
Loans (h) 134 46 1 (1) 83 292 (28) 527 34
Other assets
BlackRock Series C
Preferred Stock 243 122 (33) 332 122
Other 9 (1) 8
Total other assets 252 122 (1) (33) 340 122
Total assets $10,988 $1,246 (e) $198 $386 $(719) $158 $(1,786) $305 $(126) $10,650 $788 (f)
Liabilities
Financial derivatives (d) $ 376 $ 317 $ 2 $ (256) $ 439 $181
Other borrowed funds (h) 9 175 $ 15 199
Total liabilities $ 376 $ 326 (e) $ 2 $ (81) $ 15 $ 638 $181 (f)
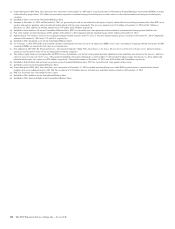
(a) Losses for assets are bracketed while losses for liabilities are not.
(b) PNC’s policy is to recognize transfers in and transfers out as of the end of the reporting period.
(c) The amount of the total gains or losses for the period included in earnings that is attributable to the change in unrealized gains or losses related to those assets and liabilities held at the
end of the reporting period.
(d) Includes swaps entered into in connection with sales of certain Visa Class B common shares.
(e) Net gains (realized and unrealized) included in earnings relating to Level 3 assets and liabilities were $261 million for 2014 compared with net gains (realized and unrealized) of $920
million for 2013. These amounts also included amortization and accretion of $146 million for 2014 compared with $217 million for 2013. The amortization and accretion amounts
were included in Interest income on the Consolidated Income Statement, and the remaining net gains/(losses) (realized and unrealized) were included in Noninterest income on the
Consolidated Income Statement.
(f) Net unrealized gains relating to those assets and liabilities held at the end of the reporting period were $204 million for 2014, compared with net unrealized gains of $607 million for
2013. These amounts were included in Noninterest income on the Consolidated Income Statement.
(g) Settlements relating to commercial MSRs of $552 million represent the fair value as of January 1, 2014 as a result of an irrevocable election to measure all classes of commercial
MSRs at fair value. Refer to Note 8 Goodwill and Other Intangible Assets for additional information on commercial MSRs.
(h) These line items were corrected for the year ended December 31, 2013 to include transferred loans over which PNC regained effective control and the related liabilities that are
recorded pursuant to ASC 860. This resulted in additional transfers into Level 3 of $15 million for both Loans and Other borrowed funds.
160 The PNC Financial Services Group, Inc. – Form 10-K