PNC Bank 2014 Annual Report Download - page 69
Download and view the complete annual report
Please find page 69 of the 2014 PNC Bank annual report below. You can navigate through the pages in the report by either clicking on the pages listed below, or by using the keyword search tool below to find specific information within the annual report.-
 1
1 -
2
-
3
-
4
-
5
-
6
-
7
-
8
-
9
-
10
-
11
-
12
-
13
-
14
-
15
-
16
-
17
-
18
-
19
-
20
-
21
-
22
-
23
-
24
-
25
-
26
-
27
-
28
-
29
-
30
-
31
-
32
-
33
-
34
-
35
-
36
-
37
-
38
-
39
-
40
-
41
-
42
-
43
-
44
-
45
-
46
-
47
-
48
-
49
-
50
-
51
-
52
-
53
-
54
-
55
-
56
-
57
-
58
-
 59
59 -
 60
60 -
 61
61 -
 62
62 -
 63
63 -
 64
64 -
 65
65 -
 66
66 -
 67
67 -
 68
68 -
 69
69 -
 70
70 -
 71
71 -
 72
72 -
 73
73 -
 74
74 -
 75
75 -
 76
76 -
 77
77 -
 78
78 -
 79
79 -
80
-
81
-
82
-
83
-
84
-
85
-
86
-
87
-
88
-
89
-
90
-
91
-
92
-
93
-
94
-
95
-
96
-
97
-
98
-
99
-
100
-
101
-
102
-
103
-
104
-
105
-
106
-
107
-
108
-
109
-
110
-
111
-
112
-
113
-
114
-
115
-
116
-
117
-
118
-
119
-
120
-
121
-
122
-
123
-
124
-
125
-
126
-
127
-
128
-
129
-
130
-
131
-
132
-
133
-
134
-
135
-
136
-
137
-
138
-
139
-
140
-
141
-
142
-
143
-
144
-
145
-
146
-
147
-
148
-
149
-
150
-
151
-
152
-
153
-
154
-
155
-
156
-
157
-
158
-
159
-
160
-
161
-
162
-
163
-
164
-
165
-
166
-
167
-
168
-
169
-
170
-
171
-
172
-
173
-
174
-
175
-
176
-
177
-
178
-
179
-
180
-
181
-
182
-
183
-
184
-
185
-
186
-
187
-
188
-
189
-
190
-
191
-
192
-
193
-
194
-
195
-
196
-
197
-
198
-
199
-
200
-
201
-
202
-
203
-
204
-
205
-
206
-
207
-
208
-
209
-
210
-
211
-
212
-
213
-
214
-
215
-
216
-
217
-
218
-
219
-
220
-
221
-
222
-
223
-
224
-
225
-
226
-
227
-
228
-
229
-
230
-
231
-
232
-
233
-
234
-
235
-
236
-
237
-
238
-
239
-
240
-
241
-
242
-
243
-
244
-
245
-
246
-
247
-
248
-
249
-
250
-
251
-
252
-
253
-
254
-
255
-
256
-
257
-
258
-
259
-
260
-
261
-
262
-
263
-
264
-
265
-
266
-
267
-
268
 |
 |

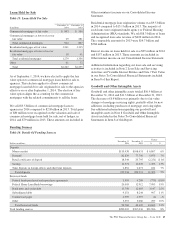
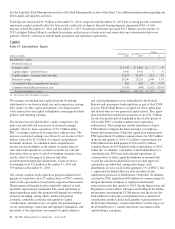
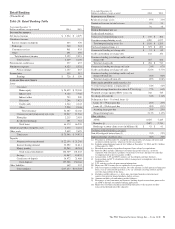
Retail Banking
(Unaudited)
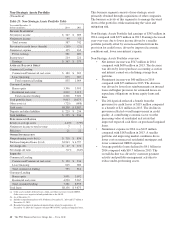
Table 20: Retail Banking Table
Year ended December 31
Dollars in millions, except as noted 2014 2013
I
NCOME
S
TATEMENT
Net interest income $ 3,924 $ 4,079
Noninterest income
Service charges on deposits 633 570
Brokerage 240 224
Consumer services 961 935
Other 291 292
Total noninterest income 2,125 2,021
Total revenue 6,049 6,100
Provision for credit losses 277 657
Noninterest expense 4,625 4,576
Pretax earnings 1,147 867
Income taxes 419 317
Earnings $ 728 $ 550
A
VERAGE
B
ALANCE
S
HEET
Loans
Consumer
Home equity $ 28,852 $ 29,300
Indirect auto 9,122 7,746
Indirect other 703 909
Education 7,208 7,923
Credit cards 4,364 4,142
Other 2,238 2,148
Total consumer 52,487 52,168
Commercial and commercial real estate 10,867 11,266
Floor plan 2,215 2,055
Residential mortgage 601 741
Total loans 66,170 66,230
Goodwill and other intangible assets 6,034 6,116
Other assets 2,842 2,625
Total assets $ 75,046 $ 74,971
Deposits
Noninterest-bearing demand $ 22,134 $ 21,248
Interest-bearing demand 33,992 31,811
Money market 50,263 48,784
Total transaction deposits 106,389 101,843
Savings 11,847 10,835
Certificates of deposit 18,972 21,488
Total deposits 137,208 134,166
Other liabilities 469 337
Total liabilities $137,677 $134,503
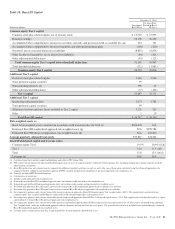
Year ended December 31
Dollars in millions, except as noted 2014 2013
P
ERFORMANCE
R
ATIOS
Return on average assets .97% .73%
Noninterest income to total revenue 35 33
Efficiency 76 75
O
THER
I
NFORMATION
(a)
Credit-related statistics:
Commercial nonperforming assets $ 139 $ 208
Consumer nonperforming assets 1,059 1,077
Total nonperforming assets (b) $ 1,198 $ 1,285
Purchased impaired loans (c) $ 575 $ 692
Commercial lending net charge-offs $ 31 $ 89
Credit card lending net charge-offs 142 156
Consumer lending (excluding credit card) net
charge-offs 285 468
Total net charge-offs $ 458 $ 713
Commercial lending net charge-off ratio .24% .67%
Credit card lending net charge-off ratio 3.25% 3.77%
Consumer lending (excluding credit card) net
charge-off ratio (d) .58% .96%
Total net charge-off ratio (d) .69% 1.08%
Home equity portfolio credit statistics: (e)
% of first lien positions at origination (f) 54% 52%
Weighted-average loan-to-value ratios (LTVs) (f) (g) 77% 81%
Weighted-average updated FICO scores (h) 748 745
Net charge-off ratio (d) .54% 1.14%
Delinquency data – % of total loans: (i)
Loans 30 – 59 days past due .20% .20%
Loans 60 – 89 days past due .09% .09%
Accruing loans past due .29% .29%
Nonperforming loans 3.13% 3.15%
Other statistics:
ATMs 8,605 7,445
Branches (j) 2,697 2,714
Brokerage account client assets (in billions) (k) $ 43 $ 41
Customer-related statistics (average):
Non-teller deposit transactions (l) 35% 25%
Digital consumer customers (m) 46% 38%
(a) Presented as of December 31, except for net charge-offs, net charge-off ratios and
customer-related statistics, which are for the year ended.
(b) Includes nonperforming loans of $1.1 billion at December 31, 2014 and $1.2 billion
at December 31, 2013.
(c) Recorded investment of purchased impaired loans related to acquisitions.
(d) Ratio for 2013 includes additional consumer charge-offs taken as a result of
alignment with interagency guidance on practices for loans and lines of credit that
we implemented in the first quarter of 2013.
(e) Lien position, LTV and FICO statistics are based upon customer balances.
(f) Lien position and LTV calculations reflect management assumptions where data
limitations exist.
(g) LTV statistics are based upon current information.
(h) Represents FICO scores that are updated at least quarterly.
(i) Data based upon recorded investment. Past due amounts exclude purchased impaired
loans, even if contractually past due, as we are currently accreting interest income
over the expected life of the loans.
(j) Excludes satellite offices (e.g., drive-ups, electronic branches and retirement
centers) that provide limited products and/or services.
(k) Amounts include cash and money market balances.
(l) Percentage of total consumer and business banking deposit transactions processed at
an ATM or through our mobile banking application.
(m) Represents consumer checking relationships that process the majority of their
transactions through non-teller channels.
The PNC Financial Services Group, Inc. – Form 10-K 51