PNC Bank 2014 Annual Report Download - page 51
Download and view the complete annual report
Please find page 51 of the 2014 PNC Bank annual report below. You can navigate through the pages in the report by either clicking on the pages listed below, or by using the keyword search tool below to find specific information within the annual report.-
 1
1 -
2
-
3
-
4
-
5
-
6
-
7
-
8
-
9
-
10
-
11
-
12
-
13
-
14
-
15
-
16
-
17
-
18
-
19
-
20
-
21
-
22
-
23
-
24
-
25
-
26
-
27
-
28
-
29
-
30
-
31
-
32
-
33
-
34
-
35
-
36
-
37
-
38
-
39
-
40
-
 41
41 -
 42
42 -
 43
43 -
 44
44 -
 45
45 -
 46
46 -
 47
47 -
 48
48 -
 49
49 -
 50
50 -
 51
51 -
 52
52 -
 53
53 -
 54
54 -
 55
55 -
 56
56 -
 57
57 -
 58
58 -
 59
59 -
 60
60 -
 61
61 -
62
-
63
-
64
-
65
-
66
-
67
-
68
-
69
-
70
-
71
-
72
-
73
-
74
-
75
-
76
-
77
-
78
-
79
-
80
-
81
-
82
-
83
-
84
-
85
-
86
-
87
-
88
-
89
-
90
-
91
-
92
-
93
-
94
-
95
-
96
-
97
-
98
-
99
-
100
-
101
-
102
-
103
-
104
-
105
-
106
-
107
-
108
-
109
-
110
-
111
-
112
-
113
-
114
-
115
-
116
-
117
-
118
-
119
-
120
-
121
-
122
-
123
-
124
-
125
-
126
-
127
-
128
-
129
-
130
-
131
-
132
-
133
-
134
-
135
-
136
-
137
-
138
-
139
-
140
-
141
-
142
-
143
-
144
-
145
-
146
-
147
-
148
-
149
-
150
-
151
-
152
-
153
-
154
-
155
-
156
-
157
-
158
-
159
-
160
-
161
-
162
-
163
-
164
-
165
-
166
-
167
-
168
-
169
-
170
-
171
-
172
-
173
-
174
-
175
-
176
-
177
-
178
-
179
-
180
-
181
-
182
-
183
-
184
-
185
-
186
-
187
-
188
-
189
-
190
-
191
-
192
-
193
-
194
-
195
-
196
-
197
-
198
-
199
-
200
-
201
-
202
-
203
-
204
-
205
-
206
-
207
-
208
-
209
-
210
-
211
-
212
-
213
-
214
-
215
-
216
-
217
-
218
-
219
-
220
-
221
-
222
-
223
-
224
-
225
-
226
-
227
-
228
-
229
-
230
-
231
-
232
-
233
-
234
-
235
-
236
-
237
-
238
-
239
-
240
-
241
-
242
-
243
-
244
-
245
-
246
-
247
-
248
-
249
-
250
-
251
-
252
-
253
-
254
-
255
-
256
-
257
-
258
-
259
-
260
-
261
-
262
-
263
-
264
-
265
-
266
-
267
-
268
 |
 |

Proceedings and Note 22 Commitments and Guarantees in the
Notes To Consolidated Financial Statements in Item 8 of this
Report.
Key Factors Affecting Financial Performance
Our financial performance is substantially affected by a
number of external factors outside of our control, including
the following:
• General economic conditions, including the
continuity, speed and stamina of the current U.S.
economic expansion in general and on our customers
in particular,
• The monetary policy actions and statements of the
Federal Reserve and the Federal Open Market
Committee (FOMC),
• The level of, and direction, timing and magnitude of
movement in, interest rates and the shape of the
interest rate yield curve,
• The functioning and other performance of, and
availability of liquidity in, the capital and other
financial markets,
• Loan demand, utilization of credit commitments and
standby letters of credit, and asset quality,
• Customer demand for non-loan products and services,
• Changes in the competitive and regulatory landscape
and in counterparty creditworthiness and
performance as the financial services industry
restructures in the current environment,
• The impact of the extensive reforms enacted in the
Dodd-Frank legislation and other legislative,
regulatory and administrative initiatives and actions,
including those outlined elsewhere in this Report and
in our other SEC filings, and
• The impact of market credit spreads on asset
valuations.
In addition, our success will depend upon, among other things:
• Focused execution of strategic priorities for organic
customer growth opportunities,
• Further success in growing profitability through the
acquisition and retention of customers and deepening
relationships,
• Driving growth in acquired and underpenetrated
geographic markets, including our Southeast markets,
• Our ability to effectively manage PNC’s balance
sheet and generate net interest income,
• Revenue growth from fee income and our ability to
provide innovative and valued products to our
customers,
• Our ability to utilize technology to develop and
deliver products and services to our customers and
protect PNC’s systems and customer information,
• Our ability to bolster our critical infrastructure and
streamline our core processes,
• Our ability to manage and implement strategic
business objectives within the changing regulatory
environment,
• A sustained focus on expense management,
• Improving our overall asset quality,
• Managing the non-strategic assets portfolio and
impaired assets,
• Continuing to maintain and grow our deposit base as
a low-cost funding source,
• Prudent risk and capital management related to our
efforts to manage risk to acceptable levels and to
meet evolving CCAR compliance, regulatory capital
and liquidity standards,
• Actions we take within the capital and other financial
markets,
• The impact of legal and regulatory-related
contingencies, and
• The appropriateness of reserves needed for critical
accounting estimates and related contingencies.
For additional information, please see the Cautionary
Statement Regarding Forward-Looking Information section in
this Item 7 and Item 1A Risk Factors in this Report.
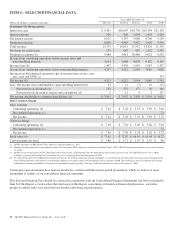
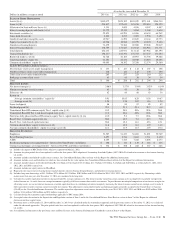
Table 1: Summary Financial Results
Year ended December 31 2014 2013
Net income (millions) $4,207 $4,212
Diluted earnings per common share from net
income $ 7.30 $ 7.36
Return from net income on:
Average common shareholders’ equity 9.91% 10.85%
Average assets 1.28% 1.38%
Income Statement Highlights
Our performance in 2014 included the following:
• Net income for 2014 of $4.2 billion was stable
compared with 2013, as a 4% decrease in revenue
was mostly offset by a reduction in provision for
credit losses and a 2% decline in noninterest expense.
Lower revenue in the comparison was driven by a
7% decline in net interest income, as noninterest
income was essentially unchanged. For additional
detail, please see the Consolidated Income Statement
Review section in this Item 7.
• Net interest income of $8.5 billion for 2014
decreased 7% compared with 2013, as lower yields
on loans and investment securities, a decline in
investment securities balances and a reduction in
purchase accounting accretion were partially offset
by commercial and commercial real estate loan
growth.
• Net interest margin decreased to 3.08 % for 2014
compared to 3.57 % for 2013. The decline reflected
the impact of lower loan and securities yields in the
ongoing low rate environment, lower purchase
accounting accretion and the impact of higher interest-
earning deposits with the Federal Reserve Bank.
The PNC Financial Services Group, Inc. – Form 10-K 33