PNC Bank 2014 Annual Report Download - page 208
Download and view the complete annual report
Please find page 208 of the 2014 PNC Bank annual report below. You can navigate through the pages in the report by either clicking on the pages listed below, or by using the keyword search tool below to find specific information within the annual report.-
 1
1 -
2
-
3
-
4
-
5
-
6
-
7
-
8
-
9
-
10
-
11
-
12
-
13
-
14
-
15
-
16
-
17
-
18
-
19
-
20
-
21
-
22
-
23
-
24
-
25
-
26
-
27
-
28
-
29
-
30
-
31
-
32
-
33
-
34
-
35
-
36
-
37
-
38
-
39
-
40
-
41
-
42
-
43
-
44
-
45
-
46
-
47
-
48
-
49
-
50
-
51
-
52
-
53
-
54
-
55
-
56
-
57
-
58
-
59
-
60
-
61
-
62
-
63
-
64
-
65
-
66
-
67
-
68
-
69
-
70
-
71
-
72
-
73
-
74
-
75
-
76
-
77
-
78
-
79
-
80
-
81
-
82
-
83
-
84
-
85
-
86
-
87
-
88
-
89
-
90
-
91
-
92
-
93
-
94
-
95
-
96
-
97
-
98
-
99
-
100
-
101
-
102
-
103
-
104
-
105
-
106
-
107
-
108
-
109
-
110
-
111
-
112
-
113
-
114
-
115
-
116
-
117
-
118
-
119
-
120
-
121
-
122
-
123
-
124
-
125
-
126
-
127
-
128
-
129
-
130
-
131
-
132
-
133
-
134
-
135
-
136
-
137
-
138
-
139
-
140
-
141
-
142
-
143
-
144
-
145
-
146
-
147
-
148
-
149
-
150
-
151
-
152
-
153
-
154
-
155
-
156
-
157
-
158
-
159
-
160
-
161
-
162
-
163
-
164
-
165
-
166
-
167
-
168
-
169
-
170
-
171
-
172
-
173
-
174
-
175
-
176
-
177
-
178
-
179
-
180
-
181
-
182
-
183
-
184
-
185
-
186
-
187
-
188
-
189
-
190
-
191
-
192
-
193
-
194
-
195
-
196
-
197
-
 198
198 -
 199
199 -
 200
200 -
 201
201 -
 202
202 -
 203
203 -
 204
204 -
 205
205 -
 206
206 -
 207
207 -
 208
208 -
 209
209 -
 210
210 -
 211
211 -
 212
212 -
 213
213 -
 214
214 -
 215
215 -
 216
216 -
 217
217 -
 218
218 -
219
-
220
-
221
-
222
-
223
-
224
-
225
-
226
-
227
-
228
-
229
-
230
-
231
-
232
-
233
-
234
-
235
-
236
-
237
-
238
-
239
-
240
-
241
-
242
-
243
-
244
-
245
-
246
-
247
-
248
-
249
-
250
-
251
-
252
-
253
-
254
-
255
-
256
-
257
-
258
-
259
-
260
-
261
-
262
-
263
-
264
-
265
-
266
-
267
-
268
 |
 |

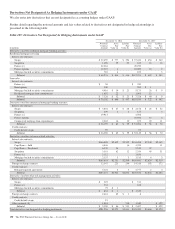
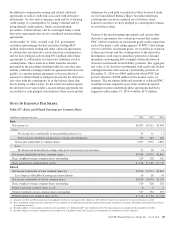
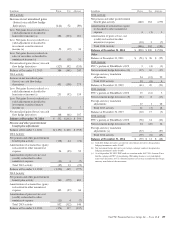
Derivatives Not Designated As Hedging Instruments under GAAP
We also enter into derivatives that are not designated as accounting hedges under GAAP.
Further detail regarding the notional amounts and fair values related to derivatives not designated in hedge relationships is
presented in the following table:
Table 129: Derivatives Not Designated As Hedging Instruments under GAAP
December 31, 2014 December 31, 2013
In millions
Notional/
Contract
Amount
Asset
Fair
Value (a)
Liability
Fair
Value (b)
Notional/
Contract
Amount
Asset
Fair
Value (a)
Liability
Fair
Value (b)
Derivatives used for residential mortgage banking activities:
Residential mortgage servicing
Interest rate contracts:
Swaps $ 32,459 $ 777 $ 394 $ 37,424 $ 654 $ 360
Swaptions 1,498 29 22 845 18 18
Futures (c) 22,084 49,250
Futures options 12,225 4 24,000 10 2
Mortgage-backed securities commitments 710 4 832 3
Subtotal $ 68,976 $ 814 $ 416 $112,351 $ 682 $ 383
Loan sales
Interest rate contracts:
Futures (c) $ 58 $ 350
Bond options 300 200 $ 1
Mortgage-backed securities commitments 4,916 $ 10 $ 21 5,173 26 $ 9
Residential mortgage loan commitments 1,852 22 1,605 13
Subtotal $ 7,126 $ 32 $ 21 $ 7,328 $ 40 $ 9
Subtotal $ 76,102 $ 846 $ 437 $119,679 $ 722 $ 392
Derivatives used for commercial mortgage banking activities:
Interest rate contracts:
Swaps $ 3,801 $ 67 $ 48 $ 2,158 $ 23 $ 52
Swaptions 439 2 1 125 3
Futures (c) 19,913 4,598
Futures options 45,500 15 4
Commercial mortgage loan commitments 2,042 16 10 673 20 11
Subtotal $ 26,195 $ 85 $ 59 $ 53,054 $ 58 $ 70
Credit contracts:
Credit default swaps 95 95
Subtotal $ 26,290 $ 85 $ 59 $ 53,149 $ 58 $ 70
Derivatives used for customer-related activities:
Interest rate contracts:
Swaps $146,008 $2,632 $2,559 $134,408 $2,540 $2,445
Caps/floors – Sold 4,846 16 4,789 11
Caps/floors – Purchased 6,339 34 5,519 37
Swaptions 3,361 62 12 2,354 49 51
Futures (c) 3,112 1,856
Mortgage-backed securities commitments 2,137 3 3 1,515 4 3
Subtotal $165,803 $2,731 $2,590 $150,441 $2,630 $2,510
Foreign exchange contracts 12,547 223 240 14,316 192 172
Credit contracts:
Risk participation agreements 5,124 2 4 4,777 2 4
Subtotal $183,474 $2,956 $2,834 $169,534 $2,824 $2,686
Derivatives used for other risk management activities:
Interest rate contracts:
Swaps $ 225 $ 511
Futures (c) 533 838
Mortgage-backed securities commitments 75 $ 1
Subtotal $ 833 $ 1 $ 1,349
Foreign exchange contracts 2,661 85 $ 1 8
Credit contracts:
Credit default swaps 15
Other contracts (d) 1,881 510 1,340 $ 422
Subtotal $ 5,390 $ 86 $ 511 $ 2,697 $ 422
Total derivatives not designated as hedging instruments $291,256 $3,973 $3,841 $345,059 $3,604 $3,570
190 The PNC Financial Services Group, Inc. – Form 10-K