PNC Bank 2014 Annual Report Download - page 162
Download and view the complete annual report
Please find page 162 of the 2014 PNC Bank annual report below. You can navigate through the pages in the report by either clicking on the pages listed below, or by using the keyword search tool below to find specific information within the annual report.-
 1
1 -
2
-
3
-
4
-
5
-
6
-
7
-
8
-
9
-
10
-
11
-
12
-
13
-
14
-
15
-
16
-
17
-
18
-
19
-
20
-
21
-
22
-
23
-
24
-
25
-
26
-
27
-
28
-
29
-
30
-
31
-
32
-
33
-
34
-
35
-
36
-
37
-
38
-
39
-
40
-
41
-
42
-
43
-
44
-
45
-
46
-
47
-
48
-
49
-
50
-
51
-
52
-
53
-
54
-
55
-
56
-
57
-
58
-
59
-
60
-
61
-
62
-
63
-
64
-
65
-
66
-
67
-
68
-
69
-
70
-
71
-
72
-
73
-
74
-
75
-
76
-
77
-
78
-
79
-
80
-
81
-
82
-
83
-
84
-
85
-
86
-
87
-
88
-
89
-
90
-
91
-
92
-
93
-
94
-
95
-
96
-
97
-
98
-
99
-
100
-
101
-
102
-
103
-
104
-
105
-
106
-
107
-
108
-
109
-
110
-
111
-
112
-
113
-
114
-
115
-
116
-
117
-
118
-
119
-
120
-
121
-
122
-
123
-
124
-
125
-
126
-
127
-
128
-
129
-
130
-
131
-
132
-
133
-
134
-
135
-
136
-
137
-
138
-
139
-
140
-
141
-
142
-
143
-
144
-
145
-
146
-
147
-
148
-
149
-
150
-
151
-
 152
152 -
 153
153 -
 154
154 -
 155
155 -
 156
156 -
 157
157 -
 158
158 -
 159
159 -
 160
160 -
 161
161 -
 162
162 -
 163
163 -
 164
164 -
 165
165 -
 166
166 -
 167
167 -
 168
168 -
 169
169 -
 170
170 -
 171
171 -
 172
172 -
173
-
174
-
175
-
176
-
177
-
178
-
179
-
180
-
181
-
182
-
183
-
184
-
185
-
186
-
187
-
188
-
189
-
190
-
191
-
192
-
193
-
194
-
195
-
196
-
197
-
198
-
199
-
200
-
201
-
202
-
203
-
204
-
205
-
206
-
207
-
208
-
209
-
210
-
211
-
212
-
213
-
214
-
215
-
216
-
217
-
218
-
219
-
220
-
221
-
222
-
223
-
224
-
225
-
226
-
227
-
228
-
229
-
230
-
231
-
232
-
233
-
234
-
235
-
236
-
237
-
238
-
239
-
240
-
241
-
242
-
243
-
244
-
245
-
246
-
247
-
248
-
249
-
250
-
251
-
252
-
253
-
254
-
255
-
256
-
257
-
258
-
259
-
260
-
261
-
262
-
263
-
264
-
265
-
266
-
267
-
268
 |
 |

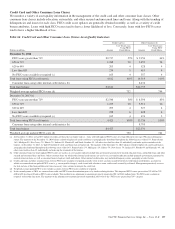
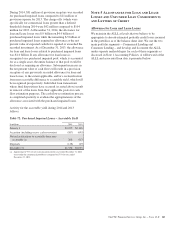
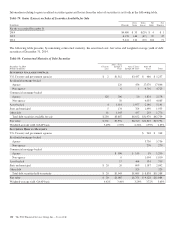
Table 73: Rollforward of Allowance for Loan and Lease Losses and Associated Loan Data
In millions
Commercial
Lending
Consumer
Lending Total
December 31, 2014
Allowance for Loan and Lease Losses
January 1 $ 1,547 $ 2,062 $ 3,609
Charge-offs (360) (661) (1,021)
Recoveries 305 185 490
Net charge-offs (55) (476) (531)
Provision for credit losses 100 173 273
Net change in allowance for unfunded loan commitments and letters of credit (18) 1 (17)
Other (3) (3)
December 31 $ 1,571 $ 1,760 $ 3,331
TDRs individually evaluated for impairment $ 62 $ 324 $ 386
Other loans individually evaluated for impairment 77 77
Loans collectively evaluated for impairment 1,353 643 1,996
Purchased impaired loans 79 793 872
December 31 $ 1,571 $ 1,760 $ 3,331
Loan Portfolio
TDRs individually evaluated for impairment (a) $ 542 $ 2,041 $ 2,583
Other loans individually evaluated for impairment 309 309
Loans collectively evaluated for impairment (b) 127,207 68,826 196,033
Fair value option loans (c) 1,034 1,034
Purchased impaired loans 310 4,548 4,858
December 31 $128,368 $76,449 $204,817
Portfolio segment ALLL as a percentage of total ALLL 47% 53% 100%
Ratio of the allowance for loan and lease losses to total loans 1.22% 2.30% 1.63%
December 31, 2013
Allowance for Loan and Lease Losses
January 1 $ 1,774 $ 2,262 $ 4,036
Charge-offs (d) (606) (982) (1,588)
Recoveries 357 154 511
Net charge-offs (249) (828) (1,077)
Provision for credit losses 36 607 643
Net change in allowance for unfunded loan commitments and letters of credit (13) 21 8
Other (1) (1)
December 31 $ 1,547 $ 2,062 $ 3,609
TDRs individually evaluated for impairment $ 24 $ 446 $ 470
Other loans individually evaluated for impairment 155 155
Loans collectively evaluated for impairment 1,235 745 1,980
Purchased impaired loans 133 871 1,004
December 31 $ 1,547 $ 2,062 $ 3,609
Loan Portfolio
TDRs individually evaluated for impairment (a) $ 578 $ 2,161 $ 2,739
Other loans individually evaluated for impairment 649 649
Loans collectively evaluated for impairment (b) 115,245 69,724 184,969
Fair value option loans (c) 1,150 1,150
Purchased impaired loans 673 5,433 6,106
December 31 $117,145 $78,468 $195,613
Portfolio segment ALLL as a percentage of total ALLL 43% 57% 100%
Ratio of the allowance for loan and lease losses to total loans 1.32% 2.63% 1.84%
144 The PNC Financial Services Group, Inc. – Form 10-K