PNC Bank 2014 Annual Report Download - page 237
Download and view the complete annual report
Please find page 237 of the 2014 PNC Bank annual report below. You can navigate through the pages in the report by either clicking on the pages listed below, or by using the keyword search tool below to find specific information within the annual report.-
 1
1 -
2
-
3
-
4
-
5
-
6
-
7
-
8
-
9
-
10
-
11
-
12
-
13
-
14
-
15
-
16
-
17
-
18
-
19
-
20
-
21
-
22
-
23
-
24
-
25
-
26
-
27
-
28
-
29
-
30
-
31
-
32
-
33
-
34
-
35
-
36
-
37
-
38
-
39
-
40
-
41
-
42
-
43
-
44
-
45
-
46
-
47
-
48
-
49
-
50
-
51
-
52
-
53
-
54
-
55
-
56
-
57
-
58
-
59
-
60
-
61
-
62
-
63
-
64
-
65
-
66
-
67
-
68
-
69
-
70
-
71
-
72
-
73
-
74
-
75
-
76
-
77
-
78
-
79
-
80
-
81
-
82
-
83
-
84
-
85
-
86
-
87
-
88
-
89
-
90
-
91
-
92
-
93
-
94
-
95
-
96
-
97
-
98
-
99
-
100
-
101
-
102
-
103
-
104
-
105
-
106
-
107
-
108
-
109
-
110
-
111
-
112
-
113
-
114
-
115
-
116
-
117
-
118
-
119
-
120
-
121
-
122
-
123
-
124
-
125
-
126
-
127
-
128
-
129
-
130
-
131
-
132
-
133
-
134
-
135
-
136
-
137
-
138
-
139
-
140
-
141
-
142
-
143
-
144
-
145
-
146
-
147
-
148
-
149
-
150
-
151
-
152
-
153
-
154
-
155
-
156
-
157
-
158
-
159
-
160
-
161
-
162
-
163
-
164
-
165
-
166
-
167
-
168
-
169
-
170
-
171
-
172
-
173
-
174
-
175
-
176
-
177
-
178
-
179
-
180
-
181
-
182
-
183
-
184
-
185
-
186
-
187
-
188
-
189
-
190
-
191
-
192
-
193
-
194
-
195
-
196
-
197
-
198
-
199
-
200
-
201
-
202
-
203
-
204
-
205
-
206
-
207
-
208
-
209
-
210
-
211
-
212
-
213
-
214
-
215
-
216
-
217
-
218
-
219
-
220
-
221
-
222
-
223
-
224
-
225
-
226
-
 227
227 -
 228
228 -
 229
229 -
 230
230 -
 231
231 -
 232
232 -
 233
233 -
 234
234 -
 235
235 -
 236
236 -
 237
237 -
 238
238 -
 239
239 -
 240
240 -
 241
241 -
 242
242 -
 243
243 -
 244
244 -
 245
245 -
 246
246 -
 247
247 -
248
-
249
-
250
-
251
-
252
-
253
-
254
-
255
-
256
-
257
-
258
-
259
-
260
-
261
-
262
-
263
-
264
-
265
-
266
-
267
-
268
 |
 |

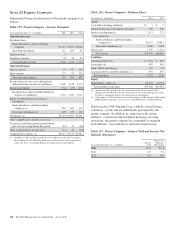
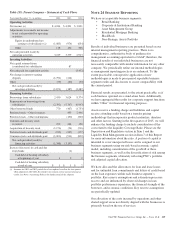
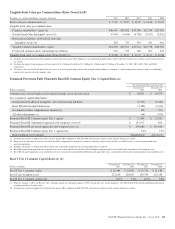
Table 158: Parent Company – Statement of Cash Flows
Year ended December 31 – in millions 2014 2013 2012
Operating Activities
Net income (a) $ 4,184 $ 4,201 $ 3,001
Adjustments to reconcile net income
to net cash provided by operating
activities:
Equity in undistributed net
earnings of subsidiaries (a) (1,083) (974) (654)
Other 118 152 566
Net cash provided (used) by
operating activities 3,219 3,379 2,913
Investing Activities
Net capital returned from
(contributed to) subsidiaries 87
Net cash paid for acquisition activity (3,432)
Net change in interest-earning
deposits (1,792) (214)
Other (79) (60) (50)
Net cash provided (used) by
investing activities (1,871) (187) (3,482)
Financing Activities
Borrowings from subsidiaries 2,430 3,624 8,374
Repayments on borrowings from
subsidiaries (2,392) (5,767) (6,943)
Other borrowed funds 770 (467) (1,753)
Preferred stock – Other issuances 495 2,446
Preferred stock – Other redemptions (150) (500)
Common and treasury stock
issuances 252 244 158
Acquisition of treasury stock (1,176) (24) (216)
Preferred stock cash dividends paid (232) (237) (177)
Common stock cash dividends paid (1,000) (911) (820)
Net cash provided (used) by
financing activities (1,348) (3,193) 569
Increase (decrease) in cash and due
from banks (1)
Cash held at banking subsidiary
at beginning of year 122
Cash held at banking subsidiary
at end of year $1$1$2
(a) Amounts for 2013 and 2012 periods have been updated to reflect the first quarter
2014 adoption of ASU 2014-01 related to investments in low income housing tax
credits. See Note 1 Accounting Policies for further detail of the adoption.
N
OTE
24 S
EGMENT
R
EPORTING
We have six reportable business segments:
• Retail Banking
• Corporate & Institutional Banking
• Asset Management Group
• Residential Mortgage Banking
• BlackRock
• Non-Strategic Assets Portfolio
Results of individual businesses are presented based on our
internal management reporting practices. There is no
comprehensive, authoritative body of guidance for
management accounting equivalent to GAAP; therefore, the
financial results of our individual businesses are not
necessarily comparable with similar information for any other
company. We periodically refine our internal methodologies
as management reporting practices are enhanced. To the
extent practicable, retrospective application of new
methodologies is made to prior period reportable business
segment results and disclosures to create comparability with
the current period.
Financial results are presented, to the extent practicable, as if
each business operated on a stand-alone basis. Additionally,
we have aggregated the results for corporate support functions
within “Other” for financial reporting purposes.
Assets receive a funding charge and liabilities and capital
receive a funding credit based on a transfer pricing
methodology that incorporates product maturities, duration
and other factors. Starting in the first quarter of 2015, we will
enhance the funding charge to include consideration of the
cost related to the Liquidity Coverage Ratio. Please see the
Supervision and Regulation section in Item 1 and the
Liquidity Risk Management section in Item 7 of this Report
for more information about the ratio. A portion of capital is
intended to cover unexpected losses and is assigned to our
business segments using our risk-based economic capital
model, including consideration of the goodwill at those
business segments, as well as the diversification of risk among
the business segments, ultimately reflecting PNC’s portfolio
risk adjusted capital allocation.
We have allocated the allowances for loan and lease losses
and for unfunded loan commitments and letters of credit based
on the loan exposures within each business segment’s
portfolio. Key reserve assumptions and estimation processes
react to and are influenced by observed changes in loan
portfolio performance experience, the financial strength of the
borrower, and economic conditions. Key reserve assumptions
are periodically updated.
Our allocation of the costs incurred by operations and other
shared support areas not directly aligned with the businesses is
primarily based on the use of services.
The PNC Financial Services Group, Inc. – Form 10-K 219