PNC Bank 2014 Annual Report Download - page 57
Download and view the complete annual report
Please find page 57 of the 2014 PNC Bank annual report below. You can navigate through the pages in the report by either clicking on the pages listed below, or by using the keyword search tool below to find specific information within the annual report.-
 1
1 -
2
-
3
-
4
-
5
-
6
-
7
-
8
-
9
-
10
-
11
-
12
-
13
-
14
-
15
-
16
-
17
-
18
-
19
-
20
-
21
-
22
-
23
-
24
-
25
-
26
-
27
-
28
-
29
-
30
-
31
-
32
-
33
-
34
-
35
-
36
-
37
-
38
-
39
-
40
-
41
-
42
-
43
-
44
-
45
-
46
-
 47
47 -
 48
48 -
 49
49 -
 50
50 -
 51
51 -
 52
52 -
 53
53 -
 54
54 -
 55
55 -
 56
56 -
 57
57 -
 58
58 -
 59
59 -
 60
60 -
 61
61 -
 62
62 -
 63
63 -
 64
64 -
 65
65 -
 66
66 -
 67
67 -
68
-
69
-
70
-
71
-
72
-
73
-
74
-
75
-
76
-
77
-
78
-
79
-
80
-
81
-
82
-
83
-
84
-
85
-
86
-
87
-
88
-
89
-
90
-
91
-
92
-
93
-
94
-
95
-
96
-
97
-
98
-
99
-
100
-
101
-
102
-
103
-
104
-
105
-
106
-
107
-
108
-
109
-
110
-
111
-
112
-
113
-
114
-
115
-
116
-
117
-
118
-
119
-
120
-
121
-
122
-
123
-
124
-
125
-
126
-
127
-
128
-
129
-
130
-
131
-
132
-
133
-
134
-
135
-
136
-
137
-
138
-
139
-
140
-
141
-
142
-
143
-
144
-
145
-
146
-
147
-
148
-
149
-
150
-
151
-
152
-
153
-
154
-
155
-
156
-
157
-
158
-
159
-
160
-
161
-
162
-
163
-
164
-
165
-
166
-
167
-
168
-
169
-
170
-
171
-
172
-
173
-
174
-
175
-
176
-
177
-
178
-
179
-
180
-
181
-
182
-
183
-
184
-
185
-
186
-
187
-
188
-
189
-
190
-
191
-
192
-
193
-
194
-
195
-
196
-
197
-
198
-
199
-
200
-
201
-
202
-
203
-
204
-
205
-
206
-
207
-
208
-
209
-
210
-
211
-
212
-
213
-
214
-
215
-
216
-
217
-
218
-
219
-
220
-
221
-
222
-
223
-
224
-
225
-
226
-
227
-
228
-
229
-
230
-
231
-
232
-
233
-
234
-
235
-
236
-
237
-
238
-
239
-
240
-
241
-
242
-
243
-
244
-
245
-
246
-
247
-
248
-
249
-
250
-
251
-
252
-
253
-
254
-
255
-
256
-
257
-
258
-
259
-
260
-
261
-
262
-
263
-
264
-
265
-
266
-
267
-
268
 |
 |

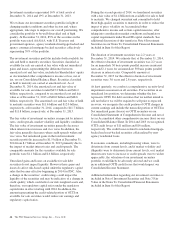
Effective Income Tax Rate
The effective income tax rate was 25.1% for 2014 compared
with 25.9% for 2013. The effective tax rate is generally lower
than the statutory rate primarily due to tax credits PNC
receives from our investments in low income housing and new
markets investments, as well as earnings in other tax exempt
investments.
The effective tax rates for both 2014 and 2013 reflect the
adoption of Accounting Standards Update (ASU) 2014-01,
which relates to amortization of investments in low income
housing tax credits. See the Recently Adopted Accounting
Standards portion of Note 1 Accounting Policies in the Notes
To Consolidated Financial Statements in Item 8 of this Report
for further detail. The retrospective application of this
guidance resulted in increased income tax expenses in both
periods due to the reclassification of noninterest expense
associated with these investments.
C
ONSOLIDATED
B
ALANCE
S
HEET
R
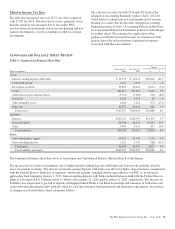
EVIEW
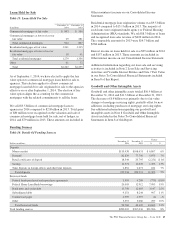
Table 6: Summarized Balance Sheet Data
Dollars in millions
December 31
2014
December 31
2013
Change
$%
Assets
Interest-earning deposits with banks $ 31,779 $ 12,135 $19,644 162%
Loans held for sale 2,262 2,255 7 –%
Investment securities 55,823 60,294 (4,471) (7)%
Loans 204,817 195,613 9,204 5%
Allowance for loan and lease losses (3,331) (3,609) 278 (8)%
Goodwill 9,103 9,074 29 –%
Other intangible assets 1,844 2,216 (372) (17)%
Other, net 42,775 42,214 561 1%
Total assets $345,072 $320,192 $24,880 8%
Liabilities
Deposits $232,234 $220,931 $11,303 5%
Borrowed funds 56,768 46,105 10,663 23%
Other 9,996 9,119 877 10%
Total liabilities 298,998 276,155 22,843 8%
Equity
Total shareholders’ equity 44,551 42,334 2,217 5%
Noncontrolling interests 1,523 1,703 (180) (11)%
Total equity 46,074 44,037 2,037 5%
Total liabilities and equity $345,072 $320,192 $24,880 8%
The summarized balance sheet data above is based upon our Consolidated Balance Sheet in Item 8 of this Report.
The increase in total assets was primarily due to higher interest-earning deposits with banks and loan growth, partially offset by
lower investment securities. The increase in interest-earning deposits with banks was driven by higher deposit balances maintained
with the Federal Reserve Bank due to regulatory short-term liquidity standards that became effective for PNC as an advanced
approaches bank beginning January 1, 2015. Interest-earning deposits with banks included balances held with the Federal Reserve
Bank of Cleveland of $31.4 billion and $11.7 billion at December 31, 2014 and December 31, 2013, respectively. The increase in
liabilities was largely due to growth in deposits and higher Federal Home Loan Bank borrowings and issuances of bank notes and
senior debt and subordinated debt, partially offset by a decline in federal funds purchased and repurchase agreements. An analysis
of changes in selected balance sheet categories follows.
The PNC Financial Services Group, Inc. – Form 10-K 39