PNC Bank 2014 Annual Report Download - page 165
Download and view the complete annual report
Please find page 165 of the 2014 PNC Bank annual report below. You can navigate through the pages in the report by either clicking on the pages listed below, or by using the keyword search tool below to find specific information within the annual report.-
 1
1 -
2
-
3
-
4
-
5
-
6
-
7
-
8
-
9
-
10
-
11
-
12
-
13
-
14
-
15
-
16
-
17
-
18
-
19
-
20
-
21
-
22
-
23
-
24
-
25
-
26
-
27
-
28
-
29
-
30
-
31
-
32
-
33
-
34
-
35
-
36
-
37
-
38
-
39
-
40
-
41
-
42
-
43
-
44
-
45
-
46
-
47
-
48
-
49
-
50
-
51
-
52
-
53
-
54
-
55
-
56
-
57
-
58
-
59
-
60
-
61
-
62
-
63
-
64
-
65
-
66
-
67
-
68
-
69
-
70
-
71
-
72
-
73
-
74
-
75
-
76
-
77
-
78
-
79
-
80
-
81
-
82
-
83
-
84
-
85
-
86
-
87
-
88
-
89
-
90
-
91
-
92
-
93
-
94
-
95
-
96
-
97
-
98
-
99
-
100
-
101
-
102
-
103
-
104
-
105
-
106
-
107
-
108
-
109
-
110
-
111
-
112
-
113
-
114
-
115
-
116
-
117
-
118
-
119
-
120
-
121
-
122
-
123
-
124
-
125
-
126
-
127
-
128
-
129
-
130
-
131
-
132
-
133
-
134
-
135
-
136
-
137
-
138
-
139
-
140
-
141
-
142
-
143
-
144
-
145
-
146
-
147
-
148
-
149
-
150
-
151
-
152
-
153
-
154
-
 155
155 -
 156
156 -
 157
157 -
 158
158 -
 159
159 -
 160
160 -
 161
161 -
 162
162 -
 163
163 -
 164
164 -
 165
165 -
 166
166 -
 167
167 -
 168
168 -
 169
169 -
 170
170 -
 171
171 -
 172
172 -
 173
173 -
 174
174 -
 175
175 -
176
-
177
-
178
-
179
-
180
-
181
-
182
-
183
-
184
-
185
-
186
-
187
-
188
-
189
-
190
-
191
-
192
-
193
-
194
-
195
-
196
-
197
-
198
-
199
-
200
-
201
-
202
-
203
-
204
-
205
-
206
-
207
-
208
-
209
-
210
-
211
-
212
-
213
-
214
-
215
-
216
-
217
-
218
-
219
-
220
-
221
-
222
-
223
-
224
-
225
-
226
-
227
-
228
-
229
-
230
-
231
-
232
-
233
-
234
-
235
-
236
-
237
-
238
-
239
-
240
-
241
-
242
-
243
-
244
-
245
-
246
-
247
-
248
-
249
-
250
-
251
-
252
-
253
-
254
-
255
-
256
-
257
-
258
-
259
-
260
-
261
-
262
-
263
-
264
-
265
-
266
-
267
-
268
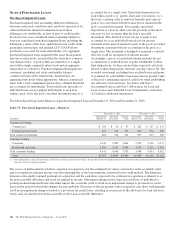
 |
 |

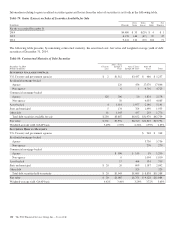
In millions
Amortized
Cost
Unrealized Fair
ValueGains Losses
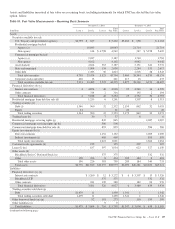
Commercial mortgage-backed
Agency 1,251 49 1,300
Non-agency 1,687 20 (5) 1,702
Asset-backed 1,009 2 (10) 1,001
State and municipal 1,055 10 (4) 1,061
Other debt 339 9 348
Total securities held to maturity $11,687 $169 $(91) $11,765
(a) Held to maturity securities transferred from available for sale are included in held to maturity at fair value at the time of transfer. The amortized cost of held to maturity securities
included net unrealized gains of $125 million and $111 million at December 31, 2014 and 2013, respectively, related to securities transferred, which are offset in Accumulated Other
Comprehensive Income, net of tax.
(b) These line items were corrected for the prior periods due to a misclassification of Government National Mortgage Association (GNMA) securities collateralized by project loans. $1.1
billion was previously reported as residential mortgage-backed agency securities at December 31, 2013, and was reclassified to commercial mortgage-backed agency securities.
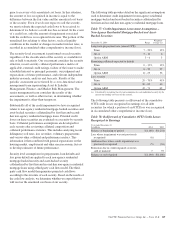
The fair value of investment securities is impacted by interest
rates, credit spreads, market volatility and liquidity conditions.
Net unrealized gains and losses in the securities available for
sale portfolio are included in Shareholders’ equity as
Accumulated other comprehensive income or loss, net of tax,
unless credit-related. Securities held to maturity are carried at
amortized cost. At December 31, 2014, Accumulated other
comprehensive income included pretax gains of $63 million
from derivatives that hedged the purchase of investment
securities classified as held to maturity. The gains will be
accreted into interest income as an adjustment of yield on the
securities.
During the second quarter of 2014, we transferred securities
with a fair value of $1.4 billion from available for sale to held
to maturity. The securities transferred included $1.0 billion of
state and municipal securities, $.2 billion of agency residential
and commercial mortgage-backed securities, and $.2 billion of
non-agency commercial mortgage-backed securities. The non-
agency commercial mortgage-backed and state and municipal
securities were all rated either AAA or AA. We changed our
intent and committed to hold these high-quality securities to
maturity in order to reduce the impact of price volatility on
Accumulated other comprehensive income and certain capital
measures, after taking into consideration market conditions.
The securities were reclassified at fair value at the time of
transfer and the transfer represented a non-cash transaction.
Accumulated other comprehensive income included net pretax
unrealized gains of $44 million at transfer, which are being
accreted over the remaining life of the related securities as an
adjustment of yield in a manner consistent with the
amortization of the net premium on the same transferred
securities, resulting in no impact on net income.
Table 76 presents gross unrealized losses on securities
available for sale at December 31, 2014 and December 31,
2013. The securities are segregated between investments that
have been in a continuous unrealized loss position for less
than twelve months and twelve months or more based on the
point in time that the fair value declined below the amortized
cost basis. The table includes debt securities where a portion
of other-than-temporary impairment (OTTI) has been
recognized in Accumulated other comprehensive income
(loss).
The PNC Financial Services Group, Inc. – Form 10-K 147