PNC Bank 2014 Annual Report Download - page 157
Download and view the complete annual report
Please find page 157 of the 2014 PNC Bank annual report below. You can navigate through the pages in the report by either clicking on the pages listed below, or by using the keyword search tool below to find specific information within the annual report.-
 1
1 -
2
-
3
-
4
-
5
-
6
-
7
-
8
-
9
-
10
-
11
-
12
-
13
-
14
-
15
-
16
-
17
-
18
-
19
-
20
-
21
-
22
-
23
-
24
-
25
-
26
-
27
-
28
-
29
-
30
-
31
-
32
-
33
-
34
-
35
-
36
-
37
-
38
-
39
-
40
-
41
-
42
-
43
-
44
-
45
-
46
-
47
-
48
-
49
-
50
-
51
-
52
-
53
-
54
-
55
-
56
-
57
-
58
-
59
-
60
-
61
-
62
-
63
-
64
-
65
-
66
-
67
-
68
-
69
-
70
-
71
-
72
-
73
-
74
-
75
-
76
-
77
-
78
-
79
-
80
-
81
-
82
-
83
-
84
-
85
-
86
-
87
-
88
-
89
-
90
-
91
-
92
-
93
-
94
-
95
-
96
-
97
-
98
-
99
-
100
-
101
-
102
-
103
-
104
-
105
-
106
-
107
-
108
-
109
-
110
-
111
-
112
-
113
-
114
-
115
-
116
-
117
-
118
-
119
-
120
-
121
-
122
-
123
-
124
-
125
-
126
-
127
-
128
-
129
-
130
-
131
-
132
-
133
-
134
-
135
-
136
-
137
-
138
-
139
-
140
-
141
-
142
-
143
-
144
-
145
-
146
-
 147
147 -
 148
148 -
 149
149 -
 150
150 -
 151
151 -
 152
152 -
 153
153 -
 154
154 -
 155
155 -
 156
156 -
 157
157 -
 158
158 -
 159
159 -
 160
160 -
 161
161 -
 162
162 -
 163
163 -
 164
164 -
 165
165 -
 166
166 -
 167
167 -
168
-
169
-
170
-
171
-
172
-
173
-
174
-
175
-
176
-
177
-
178
-
179
-
180
-
181
-
182
-
183
-
184
-
185
-
186
-
187
-
188
-
189
-
190
-
191
-
192
-
193
-
194
-
195
-
196
-
197
-
198
-
199
-
200
-
201
-
202
-
203
-
204
-
205
-
206
-
207
-
208
-
209
-
210
-
211
-
212
-
213
-
214
-
215
-
216
-
217
-
218
-
219
-
220
-
221
-
222
-
223
-
224
-
225
-
226
-
227
-
228
-
229
-
230
-
231
-
232
-
233
-
234
-
235
-
236
-
237
-
238
-
239
-
240
-
241
-
242
-
243
-
244
-
245
-
246
-
247
-
248
-
249
-
250
-
251
-
252
-
253
-
254
-
255
-
256
-
257
-
258
-
259
-
260
-
261
-
262
-
263
-
264
-
265
-
266
-
267
-
268
 |
 |

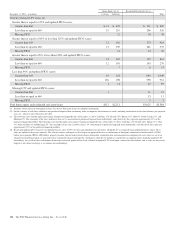
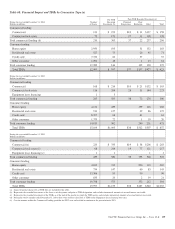
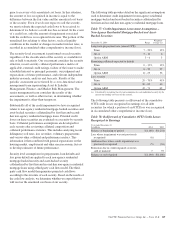
Table 68: Financial Impact and TDRs by Concession Type (a)
Number
of Loans
Pre-TDR
Recorded
Investment (b)
Post-TDR Recorded Investment (c)
During the year ended December 31, 2014
Dollars in millions
Principal
Forgiveness
Rate
Reduction Other Total
Commercial lending
Commercial 131 $ 192 $10 $ 11 $137 $ 158
Commercial real estate 79 171 27 11 100 138
Total commercial lending (d) 210 363 37 22 237 296
Consumer lending
Home equity 2,950 193 51 132 183
Residential real estate 527 73 26 45 71
Credit card 7,720 60 57 57
Other consumer 1,092 18 1 13 14
Total consumer lending 12,289 344 135 190 325
Total TDRs 12,499 $ 707 $37 $157 $427 $ 621
During the year ended December 31, 2013
Dollars in millions
Commercial lending
Commercial 168 $ 216 $10 $ 21 $132 $ 163
Commercial real estate 116 284 28 51 144 223
Equipment lease financing 1 3
Total commercial lending 285 503 38 72 276 386
Consumer lending
Home equity 4,132 289 139 126 265
Residential real estate 911 127 39 86 125
Credit card 8,397 64 61 61
Other consumer 1,379 22 1 19 20
Total consumer lending 14,819 502 240 231 471
Total TDRs 15,104 $1,005 $38 $312 $507 $ 857
During the year ended December 31, 2012
Dollars in millions
Commercial lending
Commercial (e) 220 $ 335 $19 $ 58 $206 $ 283
Commercial real estate (e) 68 244 19 77 121 217
Equipment lease financing (e) 1 1 1 1
Total commercial lending 289 580 38 135 328 501
Consumer lending
Home equity 4,813 313 200 110 310
Residential real estate 754 147 60 83 143
Credit card 13,306 93 90 90
Other consumer 835 20 2 19 21
Total consumer lending 19,708 573 352 212 564
Total TDRs 19,997 $1,153 $38 $487 $540 $1,065
(a) Impact of partial charge-offs at TDR date are included in this table.
(b) Represents the recorded investment of the loans as of the quarter end prior to TDR designation, and excludes immaterial amounts of accrued interest receivable.
(c) Represents the recorded investment of the TDRs as of the end of the quarter in which the TDR occurs, and excludes immaterial amounts of accrued interest receivable.
(d) During the twelve months ended December 31, 2014, there were no loans classified as TDRs in the Equipment lease financing loan class.
(e) Certain amounts within the Commercial lending portfolio for 2012 were reclassified to conform to the presentation in 2013.
The PNC Financial Services Group, Inc. – Form 10-K 139