PNC Bank 2014 Annual Report Download - page 247
Download and view the complete annual report
Please find page 247 of the 2014 PNC Bank annual report below. You can navigate through the pages in the report by either clicking on the pages listed below, or by using the keyword search tool below to find specific information within the annual report.-
 1
1 -
2
-
3
-
4
-
5
-
6
-
7
-
8
-
9
-
10
-
11
-
12
-
13
-
14
-
15
-
16
-
17
-
18
-
19
-
20
-
21
-
22
-
23
-
24
-
25
-
26
-
27
-
28
-
29
-
30
-
31
-
32
-
33
-
34
-
35
-
36
-
37
-
38
-
39
-
40
-
41
-
42
-
43
-
44
-
45
-
46
-
47
-
48
-
49
-
50
-
51
-
52
-
53
-
54
-
55
-
56
-
57
-
58
-
59
-
60
-
61
-
62
-
63
-
64
-
65
-
66
-
67
-
68
-
69
-
70
-
71
-
72
-
73
-
74
-
75
-
76
-
77
-
78
-
79
-
80
-
81
-
82
-
83
-
84
-
85
-
86
-
87
-
88
-
89
-
90
-
91
-
92
-
93
-
94
-
95
-
96
-
97
-
98
-
99
-
100
-
101
-
102
-
103
-
104
-
105
-
106
-
107
-
108
-
109
-
110
-
111
-
112
-
113
-
114
-
115
-
116
-
117
-
118
-
119
-
120
-
121
-
122
-
123
-
124
-
125
-
126
-
127
-
128
-
129
-
130
-
131
-
132
-
133
-
134
-
135
-
136
-
137
-
138
-
139
-
140
-
141
-
142
-
143
-
144
-
145
-
146
-
147
-
148
-
149
-
150
-
151
-
152
-
153
-
154
-
155
-
156
-
157
-
158
-
159
-
160
-
161
-
162
-
163
-
164
-
165
-
166
-
167
-
168
-
169
-
170
-
171
-
172
-
173
-
174
-
175
-
176
-
177
-
178
-
179
-
180
-
181
-
182
-
183
-
184
-
185
-
186
-
187
-
188
-
189
-
190
-
191
-
192
-
193
-
194
-
195
-
196
-
197
-
198
-
199
-
200
-
201
-
202
-
203
-
204
-
205
-
206
-
207
-
208
-
209
-
210
-
211
-
212
-
213
-
214
-
215
-
216
-
217
-
218
-
219
-
220
-
221
-
222
-
223
-
224
-
225
-
226
-
227
-
228
-
229
-
230
-
231
-
232
-
233
-
234
-
235
-
236
-
 237
237 -
 238
238 -
 239
239 -
 240
240 -
 241
241 -
 242
242 -
 243
243 -
 244
244 -
 245
245 -
 246
246 -
 247
247 -
 248
248 -
 249
249 -
 250
250 -
 251
251 -
 252
252 -
 253
253 -
 254
254 -
 255
255 -
 256
256 -
 257
257 -
258
-
259
-
260
-
261
-
262
-
263
-
264
-
265
-
266
-
267
-
268
 |
 |

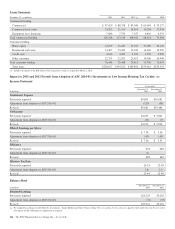
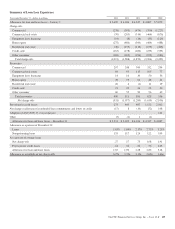
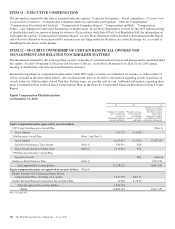
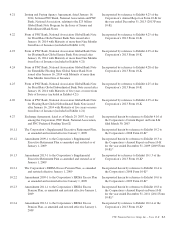
Summary of Loan Loss Experience
Year ended December 31 – dollars in millions 2014 2013 2012 2011 2010
Allowance for loan and lease losses – January 1 $ 3,609 $ 4,036 $ 4,347 $ 4,887 $ 5,072
Charge-offs
Commercial (276) (395) (474) (700) (1,227)
Commercial real estate (70) (203) (314) (464) (670)
Equipment lease financing (14) (8) (16) (35) (120)
Home equity (275) (486) (560) (484) (488)
Residential real estate (40) (133) (110) (153) (406)
Credit card (163) (178) (200) (235) (335)
Other consumer (183) (185) (196) (193) (246)
Total charge-offs (1,021) (1,588) (1,870) (2,264) (3,492)
Recoveries
Commercial 207 248 300 332 294
Commercial real estate 84 93 115 105 77
Equipment lease financing 14 16 30 50 56
Home equity 78 73 61 48 41
Residential real estate 26 4 (1) 11 19
Credit card 21 22 26 23 20
Other consumer 60 55 50 56 49
Total recoveries 490 511 581 625 556
Net charge-offs (531) (1,077) (1,289) (1,639) (2,936)
Provision for credit losses 273 643 987 1,152 2,502
Net change in allowance for unfunded loan commitments and letters of credit (17) 8 (10) (52) 108
Adoption of ASU 2009-17, Consolidations 141
Other (3) (1) 1 (1)
Allowance for loan and lease losses – December 31 $ 3,331 $ 3,609 $ 4,036 $ 4,347 $ 4,887
Allowance as a percent of December 31:
Loans 1.63% 1.84% 2.17% 2.73% 3.25%
Nonperforming loans 133 117 124 122 109
As a percent of average loans
Net charge-offs .27 .57 .73 1.08 1.91
Provision for credit losses .14 .34 .56 .76 1.63
Allowance for loan and lease losses 1.67 1.90 2.28 2.86 3.18
Allowance as a multiple of net charge-offs 6.27x 3.35x 3.13x 2.65x 1.66x
The PNC Financial Services Group, Inc. – Form 10-K 229