PNC Bank 2014 Annual Report Download - page 205
Download and view the complete annual report
Please find page 205 of the 2014 PNC Bank annual report below. You can navigate through the pages in the report by either clicking on the pages listed below, or by using the keyword search tool below to find specific information within the annual report.-
 1
1 -
2
-
3
-
4
-
5
-
6
-
7
-
8
-
9
-
10
-
11
-
12
-
13
-
14
-
15
-
16
-
17
-
18
-
19
-
20
-
21
-
22
-
23
-
24
-
25
-
26
-
27
-
28
-
29
-
30
-
31
-
32
-
33
-
34
-
35
-
36
-
37
-
38
-
39
-
40
-
41
-
42
-
43
-
44
-
45
-
46
-
47
-
48
-
49
-
50
-
51
-
52
-
53
-
54
-
55
-
56
-
57
-
58
-
59
-
60
-
61
-
62
-
63
-
64
-
65
-
66
-
67
-
68
-
69
-
70
-
71
-
72
-
73
-
74
-
75
-
76
-
77
-
78
-
79
-
80
-
81
-
82
-
83
-
84
-
85
-
86
-
87
-
88
-
89
-
90
-
91
-
92
-
93
-
94
-
95
-
96
-
97
-
98
-
99
-
100
-
101
-
102
-
103
-
104
-
105
-
106
-
107
-
108
-
109
-
110
-
111
-
112
-
113
-
114
-
115
-
116
-
117
-
118
-
119
-
120
-
121
-
122
-
123
-
124
-
125
-
126
-
127
-
128
-
129
-
130
-
131
-
132
-
133
-
134
-
135
-
136
-
137
-
138
-
139
-
140
-
141
-
142
-
143
-
144
-
145
-
146
-
147
-
148
-
149
-
150
-
151
-
152
-
153
-
154
-
155
-
156
-
157
-
158
-
159
-
160
-
161
-
162
-
163
-
164
-
165
-
166
-
167
-
168
-
169
-
170
-
171
-
172
-
173
-
174
-
175
-
176
-
177
-
178
-
179
-
180
-
181
-
182
-
183
-
184
-
185
-
186
-
187
-
188
-
189
-
190
-
191
-
192
-
193
-
194
-
 195
195 -
 196
196 -
 197
197 -
 198
198 -
 199
199 -
 200
200 -
 201
201 -
 202
202 -
 203
203 -
 204
204 -
 205
205 -
 206
206 -
 207
207 -
 208
208 -
 209
209 -
 210
210 -
 211
211 -
 212
212 -
 213
213 -
 214
214 -
 215
215 -
216
-
217
-
218
-
219
-
220
-
221
-
222
-
223
-
224
-
225
-
226
-
227
-
228
-
229
-
230
-
231
-
232
-
233
-
234
-
235
-
236
-
237
-
238
-
239
-
240
-
241
-
242
-
243
-
244
-
245
-
246
-
247
-
248
-
249
-
250
-
251
-
252
-
253
-
254
-
255
-
256
-
257
-
258
-
259
-
260
-
261
-
262
-
263
-
264
-
265
-
266
-
267
-
268
 |
 |

N
OTE
15 F
INANCIAL
D
ERIVATIVES
We use derivative financial instruments (derivatives) primarily to help manage exposure to interest rate, market and credit risk and
reduce the effects that changes in interest rates may have on net income, the fair value of assets and liabilities, and cash flows. We
also enter into derivatives with customers to facilitate their risk management activities.
Derivatives represent contracts between parties that usually require little or no initial net investment and result in one party
delivering cash or another type of asset to the other party based on a notional amount and an underlying as specified in the contract.
Derivative transactions are often measured in terms of notional amount, but this amount is generally not exchanged and it is not
recorded on the balance sheet. The notional amount is the basis to which the underlying is applied to determine required payments
under the derivative contract. The underlying is a referenced interest rate (commonly LIBOR), security price, credit spread or other
index. Residential and commercial real estate loan commitments associated with loans to be sold also qualify as derivative
instruments.
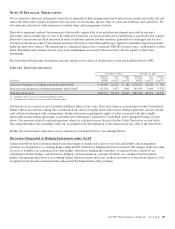
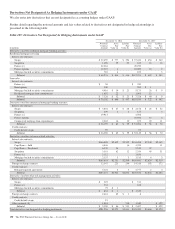
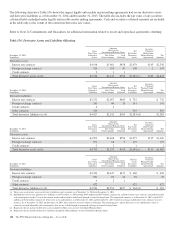
The following table presents the notional amounts and gross fair values of all derivative assets and liabilities held by PNC:
Table 124: Total Gross Derivatives
December 31, 2014 December 31, 2013
In millions
Notional/
Contract
Amount
Asset
Fair
Value (a)
Liability
Fair
Value (b)
Notional/
Contract
Amount
Asset
Fair
Value (a)
Liability
Fair
Value (b)
Derivatives designated as hedging instruments under GAAP $ 49,061 $1,261 $ 186 $ 36,197 $1,189 $ 364
Derivatives not designated as hedging instruments under GAAP 291,256 3,973 3,841 345,059 3,604 3,570
Total gross derivatives $340,317 $5,234 $4,027 $381,256 $4,793 $3,934
(a) Included in Other assets on our Consolidated Balance Sheet.
(b) Included in Other liabilities on our Consolidated Balance Sheet.
All derivatives are carried on our Consolidated Balance Sheet at fair value. Derivative balances are presented on the Consolidated
Balance Sheet on a net basis taking into consideration the effects of legally enforceable master netting agreements and any related
cash collateral exchanged with counterparties. Further discussion regarding the rights of setoff associated with these legally
enforceable master netting agreements is included in the Offsetting, Counterparty Credit Risk, and Contingent Features section
below. Our exposure related to risk participations where we sold protection is discussed in the Credit Derivatives section below.
Any nonperformance risk, including credit risk, is included in the determination of the estimated net fair value of the derivatives.
Further discussion on how derivatives are accounted for is included in Note 1 Accounting Policies.
Derivatives Designated As Hedging Instruments under GAAP
Certain derivatives used to manage interest rate and foreign exchange risk as part of our asset and liability risk management
activities are designated as accounting hedges under GAAP. Derivatives hedging the risks associated with changes in the fair value
of assets or liabilities are considered fair value hedges, derivatives hedging the variability of expected future cash flows are
considered cash flow hedges, and derivatives hedging a net investment in a foreign subsidiary are considered net investment
hedges. Designating derivatives as accounting hedges allows for gains and losses on those derivatives, to the extent effective, to be
recognized in the income statement in the same period the hedged items affect earnings.
The PNC Financial Services Group, Inc. – Form 10-K 187