PNC Bank 2014 Annual Report Download - page 151
Download and view the complete annual report
Please find page 151 of the 2014 PNC Bank annual report below. You can navigate through the pages in the report by either clicking on the pages listed below, or by using the keyword search tool below to find specific information within the annual report.-
 1
1 -
2
-
3
-
4
-
5
-
6
-
7
-
8
-
9
-
10
-
11
-
12
-
13
-
14
-
15
-
16
-
17
-
18
-
19
-
20
-
21
-
22
-
23
-
24
-
25
-
26
-
27
-
28
-
29
-
30
-
31
-
32
-
33
-
34
-
35
-
36
-
37
-
38
-
39
-
40
-
41
-
42
-
43
-
44
-
45
-
46
-
47
-
48
-
49
-
50
-
51
-
52
-
53
-
54
-
55
-
56
-
57
-
58
-
59
-
60
-
61
-
62
-
63
-
64
-
65
-
66
-
67
-
68
-
69
-
70
-
71
-
72
-
73
-
74
-
75
-
76
-
77
-
78
-
79
-
80
-
81
-
82
-
83
-
84
-
85
-
86
-
87
-
88
-
89
-
90
-
91
-
92
-
93
-
94
-
95
-
96
-
97
-
98
-
99
-
100
-
101
-
102
-
103
-
104
-
105
-
106
-
107
-
108
-
109
-
110
-
111
-
112
-
113
-
114
-
115
-
116
-
117
-
118
-
119
-
120
-
121
-
122
-
123
-
124
-
125
-
126
-
127
-
128
-
129
-
130
-
131
-
132
-
133
-
134
-
135
-
136
-
137
-
138
-
139
-
140
-
 141
141 -
 142
142 -
 143
143 -
 144
144 -
 145
145 -
 146
146 -
 147
147 -
 148
148 -
 149
149 -
 150
150 -
 151
151 -
 152
152 -
 153
153 -
 154
154 -
 155
155 -
 156
156 -
 157
157 -
 158
158 -
 159
159 -
 160
160 -
 161
161 -
162
-
163
-
164
-
165
-
166
-
167
-
168
-
169
-
170
-
171
-
172
-
173
-
174
-
175
-
176
-
177
-
178
-
179
-
180
-
181
-
182
-
183
-
184
-
185
-
186
-
187
-
188
-
189
-
190
-
191
-
192
-
193
-
194
-
195
-
196
-
197
-
198
-
199
-
200
-
201
-
202
-
203
-
204
-
205
-
206
-
207
-
208
-
209
-
210
-
211
-
212
-
213
-
214
-
215
-
216
-
217
-
218
-
219
-
220
-
221
-
222
-
223
-
224
-
225
-
226
-
227
-
228
-
229
-
230
-
231
-
232
-
233
-
234
-
235
-
236
-
237
-
238
-
239
-
240
-
241
-
242
-
243
-
244
-
245
-
246
-
247
-
248
-
249
-
250
-
251
-
252
-
253
-
254
-
255
-
256
-
257
-
258
-
259
-
260
-
261
-
262
-
263
-
264
-
265
-
266
-
267
-
268
 |
 |

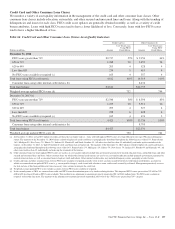
Consumer Lending Asset Classes
Home Equity and Residential Real Estate Loan Classes
We use several credit quality indicators, including
delinquency information, nonperforming loan information,
updated credit scores, originated and updated LTV ratios, and
geography, to monitor and manage credit risk within the home
equity and residential real estate loan classes. We evaluate
mortgage loan performance by source originators and loan
servicers. A summary of asset quality indicators follows:
Delinquency/Delinquency Rates: We monitor trending of
delinquency/delinquency rates for home equity and residential
real estate loans. See the Asset Quality section of this Note 3
for additional information.
Nonperforming Loans: We monitor trending of
nonperforming loans for home equity and residential real
estate loans. See the Asset Quality section of this Note 3 for
additional information.
Credit Scores: We use a national third-party provider to
update FICO credit scores for home equity loans and lines of
credit and residential real estate loans at least quarterly. The
updated scores are incorporated into a series of credit
management reports, which are utilized to monitor the risk in
the loan classes.
LTV (inclusive of combined loan-to-value (CLTV) for first
and subordinate lien positions): At least annually, we update
the property values of real estate collateral and calculate an
updated LTV ratio. For open-end credit lines secured by real
estate in regions experiencing significant declines in property
values, more frequent valuations may occur. We examine
LTV migration and stratify LTV into categories to monitor the
risk in the loan classes.
Historically, we used, and we continue to use, a combination
of original LTV and updated LTV for internal risk
management and reporting purposes (e.g., line management,
loss mitigation strategies). In addition to the fact that
estimated property values by their nature are estimates, given
certain data limitations it is important to note that updated
LTVs may be based upon management’s assumptions (e.g.,if
an updated LTV is not provided by the third-party service
provider, home price index (HPI) changes will be incorporated
in arriving at management’s estimate of updated LTV).
Geography: Geographic concentrations are monitored to
evaluate and manage exposures. Loan purchase programs are
sensitive to, and focused within, certain regions to manage
geographic exposures and associated risks.
A combination of updated FICO scores, originated and updated
LTV ratios and geographic location assigned to home equity
loans and lines of credit and residential real estate loans is used
to monitor the risk in the loan classes. Loans with higher FICO
scores and lower LTVs tend to have a lower level of risk.
Conversely, loans with lower FICO scores, higher LTVs, and in
certain geographic locations tend to have a higher level of risk.
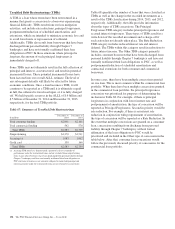
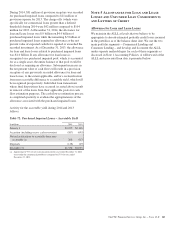
Consumer Purchased Impaired Loan Class
Estimates of the expected cash flows primarily determine the
valuation of consumer purchased impaired loans. Consumer
cash flow estimates are influenced by a number of credit
related items, which include, but are not limited to: estimated
real estate values, payment patterns, updated FICO scores, the
current economic environment, updated LTV ratios and the
date of origination. These key factors are monitored to help
ensure that concentrations of risk are managed and cash flows
are maximized.
See Note 4 Purchased Loans for additional information.
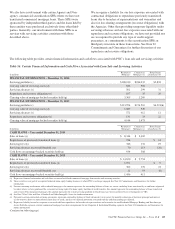
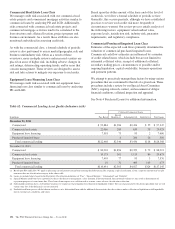
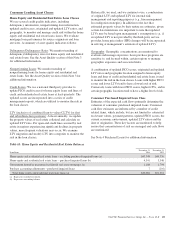
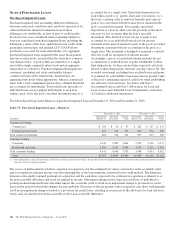
Table 63: Home Equity and Residential Real Estate Balances
In millions
December 31
2014
December 31
2013
Home equity and residential real estate loans – excluding purchased impaired loans (a) $43,348 $44,376
Home equity and residential real estate loans – purchased impaired loans (b) 4,541 5,548
Government insured or guaranteed residential real estate mortgages (a) 1,188 1,704
Purchase accounting adjustments – purchased impaired loans 7 (116)
Total home equity and residential real estate loans (a) $49,084 $51,512
(a) Represents recorded investment.
(b) Represents outstanding balance.
The PNC Financial Services Group, Inc. – Form 10-K 133