PNC Bank 2014 Annual Report Download - page 76
Download and view the complete annual report
Please find page 76 of the 2014 PNC Bank annual report below. You can navigate through the pages in the report by either clicking on the pages listed below, or by using the keyword search tool below to find specific information within the annual report.-
 1
1 -
2
-
3
-
4
-
5
-
6
-
7
-
8
-
9
-
10
-
11
-
12
-
13
-
14
-
15
-
16
-
17
-
18
-
19
-
20
-
21
-
22
-
23
-
24
-
25
-
26
-
27
-
28
-
29
-
30
-
31
-
32
-
33
-
34
-
35
-
36
-
37
-
38
-
39
-
40
-
41
-
42
-
43
-
44
-
45
-
46
-
47
-
48
-
49
-
50
-
51
-
52
-
53
-
54
-
55
-
56
-
57
-
58
-
59
-
60
-
61
-
62
-
63
-
64
-
65
-
 66
66 -
 67
67 -
 68
68 -
 69
69 -
 70
70 -
 71
71 -
 72
72 -
 73
73 -
 74
74 -
 75
75 -
 76
76 -
 77
77 -
 78
78 -
 79
79 -
 80
80 -
 81
81 -
 82
82 -
 83
83 -
 84
84 -
 85
85 -
 86
86 -
87
-
88
-
89
-
90
-
91
-
92
-
93
-
94
-
95
-
96
-
97
-
98
-
99
-
100
-
101
-
102
-
103
-
104
-
105
-
106
-
107
-
108
-
109
-
110
-
111
-
112
-
113
-
114
-
115
-
116
-
117
-
118
-
119
-
120
-
121
-
122
-
123
-
124
-
125
-
126
-
127
-
128
-
129
-
130
-
131
-
132
-
133
-
134
-
135
-
136
-
137
-
138
-
139
-
140
-
141
-
142
-
143
-
144
-
145
-
146
-
147
-
148
-
149
-
150
-
151
-
152
-
153
-
154
-
155
-
156
-
157
-
158
-
159
-
160
-
161
-
162
-
163
-
164
-
165
-
166
-
167
-
168
-
169
-
170
-
171
-
172
-
173
-
174
-
175
-
176
-
177
-
178
-
179
-
180
-
181
-
182
-
183
-
184
-
185
-
186
-
187
-
188
-
189
-
190
-
191
-
192
-
193
-
194
-
195
-
196
-
197
-
198
-
199
-
200
-
201
-
202
-
203
-
204
-
205
-
206
-
207
-
208
-
209
-
210
-
211
-
212
-
213
-
214
-
215
-
216
-
217
-
218
-
219
-
220
-
221
-
222
-
223
-
224
-
225
-
226
-
227
-
228
-
229
-
230
-
231
-
232
-
233
-
234
-
235
-
236
-
237
-
238
-
239
-
240
-
241
-
242
-
243
-
244
-
245
-
246
-
247
-
248
-
249
-
250
-
251
-
252
-
253
-
254
-
255
-
256
-
257
-
258
-
259
-
260
-
261
-
262
-
263
-
264
-
265
-
266
-
267
-
268
 |
 |
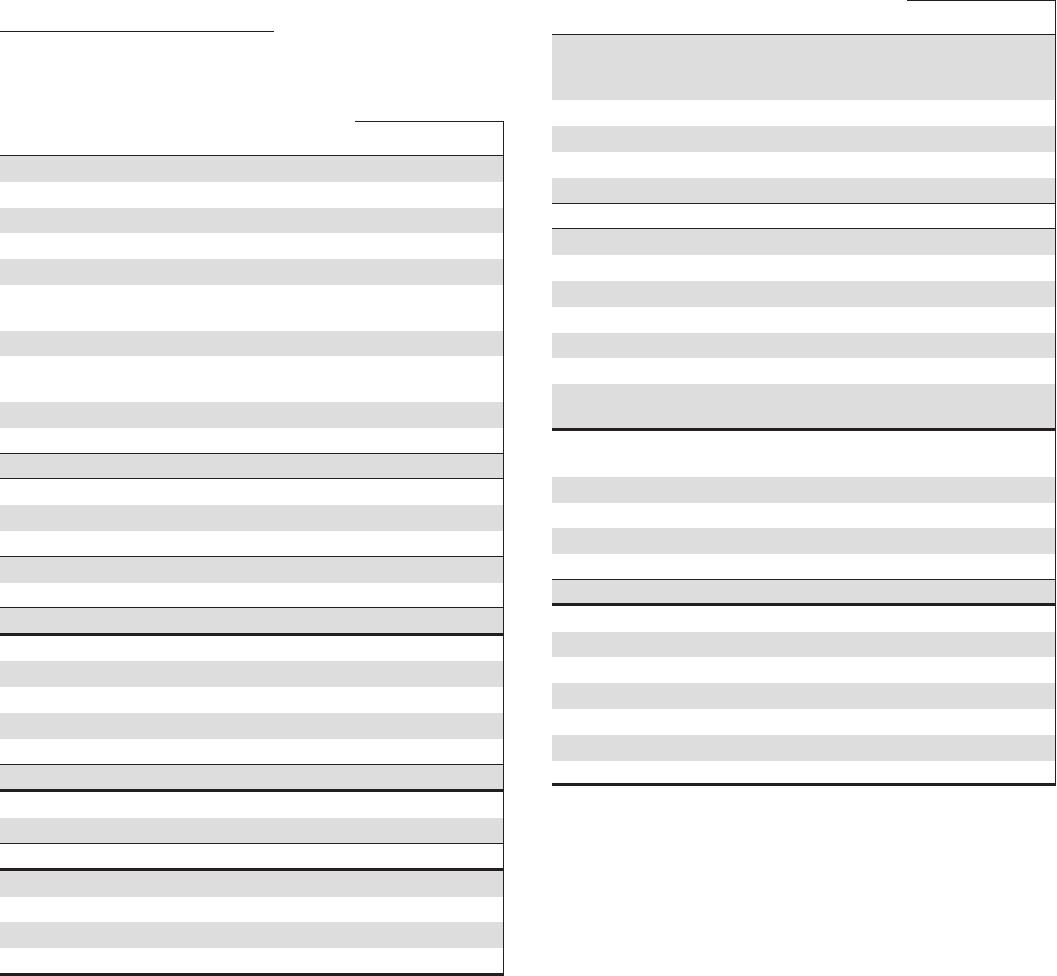
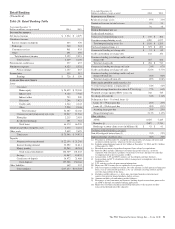
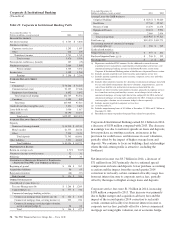
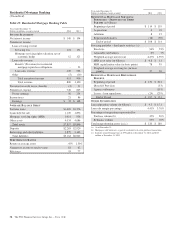
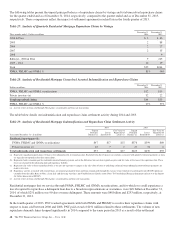
Residential Mortgage Banking
(Unaudited)
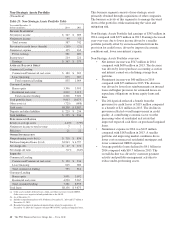
Table 23: Residential Mortgage Banking Table
Year ended December 31
Dollars in millions, except as noted 2014 2013
I
NCOME
S
TATEMENT
Net interest income $ 149 $ 194
Noninterest income
Loan servicing revenue
Servicing fees 224 174
Mortgage servicing rights valuation, net of
economic hedge 12 121
Loan sales revenue
Benefit / (Provision) for residential
mortgage repurchase obligations – 53
Loan sales revenue 420 568
Other (5) (10)
Total noninterest income 651 906
Total revenue 800 1,100
Provision for credit losses (benefit) (2) 21
Noninterest expense 746 845
Pretax earnings 56 234
Income taxes 21 86
Earnings $ 35 $ 148
A
VERAGE
B
ALANCE
S
HEET
Portfolio loans $1,689 $2,376
Loans held for sale 1,120 1,896
Mortgage servicing rights (MSR) 1,014 938
Other assets 4,034 4,686
Total assets $7,857 $9,896
Deposits $2,285 $2,920
Borrowings and other liabilities 2,879 3,142
Total liabilities $5,164 $6,062
P
ERFORMANCE
R
ATIOS
Return on average assets .45% 1.50%
Noninterest income to total revenue 81 82
Efficiency 93 77
Year ended December 31
Dollars in millions, except as noted 2014 2013
R
ESIDENTIAL
M
ORTGAGE
S
ERVICING
P
ORTFOLIO
–S
ERVICED FOR
T
HIRD
P
ARTIES
(in billions)
Beginning of period $ 114 $ 119
Acquisitions 4 10
Additions 8 15
Repayments/transfers (18) (30)
End of period $ 108 $ 114
Servicing portfolio – third-party statistics: (a)
Fixed rate 94% 93%
Adjustable rate/balloon 6% 7%
Weighted-average interest rate 4.47% 4.59%
MSR asset value (in billions) $ 0.8 $ 1.1
MSR capitalization value (in basis points) 78 95
Weighted-average servicing fee (in basis
points) 27 28
R
ESIDENTIAL
M
ORTGAGE
R
EPURCHASE
R
ESERVE
Beginning of period $ 131 $ 614
(Benefit)/ Provision (53)
Agency settlements (191)
Losses – loan repurchases (24) (239)
End of Period $ 107 $ 131
O
THER
I
NFORMATION
Loan origination volume (in billions) $ 9.5 $ 15.1
Loan sale margin percentage 4.41% 3.76%
Percentage of originations represented by:
Purchase volume (b) 45% 30%
Refinance volume 55% 70%
Total nonperforming assets (a) (c) $ 120 $ 189
(a) As of December 31.
(b) Mortgages with borrowers as part of residential real estate purchase transactions.
(c) Includes nonperforming loans of $79 million at December 31, 2014 and $143
million at December 31, 2013.
58 The PNC Financial Services Group, Inc. – Form 10-K