PNC Bank 2014 Annual Report Download - page 210
Download and view the complete annual report
Please find page 210 of the 2014 PNC Bank annual report below. You can navigate through the pages in the report by either clicking on the pages listed below, or by using the keyword search tool below to find specific information within the annual report.-
 1
1 -
2
-
3
-
4
-
5
-
6
-
7
-
8
-
9
-
10
-
11
-
12
-
13
-
14
-
15
-
16
-
17
-
18
-
19
-
20
-
21
-
22
-
23
-
24
-
25
-
26
-
27
-
28
-
29
-
30
-
31
-
32
-
33
-
34
-
35
-
36
-
37
-
38
-
39
-
40
-
41
-
42
-
43
-
44
-
45
-
46
-
47
-
48
-
49
-
50
-
51
-
52
-
53
-
54
-
55
-
56
-
57
-
58
-
59
-
60
-
61
-
62
-
63
-
64
-
65
-
66
-
67
-
68
-
69
-
70
-
71
-
72
-
73
-
74
-
75
-
76
-
77
-
78
-
79
-
80
-
81
-
82
-
83
-
84
-
85
-
86
-
87
-
88
-
89
-
90
-
91
-
92
-
93
-
94
-
95
-
96
-
97
-
98
-
99
-
100
-
101
-
102
-
103
-
104
-
105
-
106
-
107
-
108
-
109
-
110
-
111
-
112
-
113
-
114
-
115
-
116
-
117
-
118
-
119
-
120
-
121
-
122
-
123
-
124
-
125
-
126
-
127
-
128
-
129
-
130
-
131
-
132
-
133
-
134
-
135
-
136
-
137
-
138
-
139
-
140
-
141
-
142
-
143
-
144
-
145
-
146
-
147
-
148
-
149
-
150
-
151
-
152
-
153
-
154
-
155
-
156
-
157
-
158
-
159
-
160
-
161
-
162
-
163
-
164
-
165
-
166
-
167
-
168
-
169
-
170
-
171
-
172
-
173
-
174
-
175
-
176
-
177
-
178
-
179
-
180
-
181
-
182
-
183
-
184
-
185
-
186
-
187
-
188
-
189
-
190
-
191
-
192
-
193
-
194
-
195
-
196
-
197
-
198
-
199
-
 200
200 -
 201
201 -
 202
202 -
 203
203 -
 204
204 -
 205
205 -
 206
206 -
 207
207 -
 208
208 -
 209
209 -
 210
210 -
 211
211 -
 212
212 -
 213
213 -
 214
214 -
 215
215 -
 216
216 -
 217
217 -
 218
218 -
 219
219 -
 220
220 -
221
-
222
-
223
-
224
-
225
-
226
-
227
-
228
-
229
-
230
-
231
-
232
-
233
-
234
-
235
-
236
-
237
-
238
-
239
-
240
-
241
-
242
-
243
-
244
-
245
-
246
-
247
-
248
-
249
-
250
-
251
-
252
-
253
-
254
-
255
-
256
-
257
-
258
-
259
-
260
-
261
-
262
-
263
-
264
-
265
-
266
-
267
-
268
 |
 |

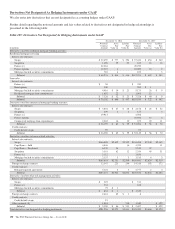
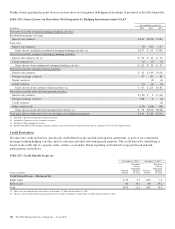
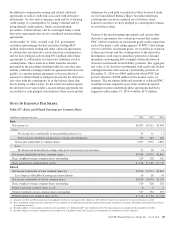
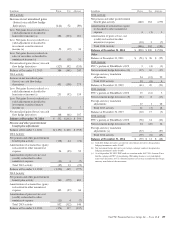
Further detail regarding the gains (losses) on derivatives not designated in hedging relationships is presented in the following table:
Table 130: Gains (Losses) on Derivatives Not Designated As Hedging Instruments under GAAP
Year ended December 31
In millions 2014 2013 2012
Derivatives used for residential mortgage banking activities:
Residential mortgage servicing
Interest rate contracts $ 240 $(223) $ 269
Loan sales
Interest rate contracts (3) 286 127
Gains (losses) included in residential mortgage banking activities (a) $ 237 $ 63 $ 396
Derivatives used for commercial mortgage banking activities:
Interest rate contracts (b) (c) $82 $12 $35
Credit contracts (c) (1) (2) (3)
Gains (losses) from commercial mortgage banking activities $ 81 $ 10 $ 32
Derivatives used for customer-related activities:
Interest rate contracts $ 41 $ 149 $ 106
Foreign exchange contracts 47 80 83
Equity contracts (3) (4)
Credit contracts (1) (1) (3)
Gains (losses) from customer-related activities (c) $ 87 $ 225 $ 182
Derivatives used for other risk management activities:
Interest rate contracts $ (19) $ 3 $ (11)
Foreign exchange contracts 188 2 (2)
Credit contracts (1)
Other contracts (d) (134) (168) (94)
Gains (losses) from other risk management activities (c) $ 35 $(163) $(108)
Total gains (losses) from derivatives not designated as hedging instruments $ 440 $ 135 $ 502
(a) Included in Residential mortgage noninterest income.
(b) Included in Corporate services noninterest income.
(c) Included in Other noninterest income.
(d) Includes BlackRock LTIP funding obligation and the swaps entered into in connection with sales of a portion of Visa Class B common shares.
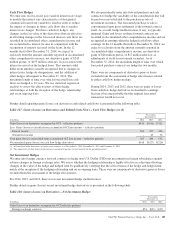
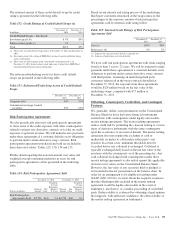
Credit Derivatives
We enter into credit derivatives, specifically credit default swaps and risk participation agreements, as part of our commercial
mortgage banking hedging activities and for customer and other risk management purposes. The credit derivative underlying is
based on the credit risk of a specific entity, entities, or an index. Detail regarding credit default swaps purchased and risk
participations sold follows.
Table 131: Credit Default Swaps (a)
December 31, 2014 December 31, 2013
Dollars in millions
Notional
Amount
Weighted-
Average
Remaining
Maturity
In Years
Notional
Amount
Weighted-
Average
Remaining
Maturity
In Years
Credit Default Swaps – Purchased (b)
Single name $ 50 5.7 $35 7.3
Index traded 60 34.2 60 35.2
Total $110 21.3 $95 24.9
(a) There were no credit default swaps sold as of December 31, 2014 and December 31, 2013.
(b) The fair value of credit default swaps purchased was less than $1 million as of December 31, 2014 and December 31, 2013.
192 The PNC Financial Services Group, Inc. – Form 10-K