PNC Bank 2014 Annual Report Download - page 241
Download and view the complete annual report
Please find page 241 of the 2014 PNC Bank annual report below. You can navigate through the pages in the report by either clicking on the pages listed below, or by using the keyword search tool below to find specific information within the annual report.-
 1
1 -
2
-
3
-
4
-
5
-
6
-
7
-
8
-
9
-
10
-
11
-
12
-
13
-
14
-
15
-
16
-
17
-
18
-
19
-
20
-
21
-
22
-
23
-
24
-
25
-
26
-
27
-
28
-
29
-
30
-
31
-
32
-
33
-
34
-
35
-
36
-
37
-
38
-
39
-
40
-
41
-
42
-
43
-
44
-
45
-
46
-
47
-
48
-
49
-
50
-
51
-
52
-
53
-
54
-
55
-
56
-
57
-
58
-
59
-
60
-
61
-
62
-
63
-
64
-
65
-
66
-
67
-
68
-
69
-
70
-
71
-
72
-
73
-
74
-
75
-
76
-
77
-
78
-
79
-
80
-
81
-
82
-
83
-
84
-
85
-
86
-
87
-
88
-
89
-
90
-
91
-
92
-
93
-
94
-
95
-
96
-
97
-
98
-
99
-
100
-
101
-
102
-
103
-
104
-
105
-
106
-
107
-
108
-
109
-
110
-
111
-
112
-
113
-
114
-
115
-
116
-
117
-
118
-
119
-
120
-
121
-
122
-
123
-
124
-
125
-
126
-
127
-
128
-
129
-
130
-
131
-
132
-
133
-
134
-
135
-
136
-
137
-
138
-
139
-
140
-
141
-
142
-
143
-
144
-
145
-
146
-
147
-
148
-
149
-
150
-
151
-
152
-
153
-
154
-
155
-
156
-
157
-
158
-
159
-
160
-
161
-
162
-
163
-
164
-
165
-
166
-
167
-
168
-
169
-
170
-
171
-
172
-
173
-
174
-
175
-
176
-
177
-
178
-
179
-
180
-
181
-
182
-
183
-
184
-
185
-
186
-
187
-
188
-
189
-
190
-
191
-
192
-
193
-
194
-
195
-
196
-
197
-
198
-
199
-
200
-
201
-
202
-
203
-
204
-
205
-
206
-
207
-
208
-
209
-
210
-
211
-
212
-
213
-
214
-
215
-
216
-
217
-
218
-
219
-
220
-
221
-
222
-
223
-
224
-
225
-
226
-
227
-
228
-
229
-
230
-
 231
231 -
 232
232 -
 233
233 -
 234
234 -
 235
235 -
 236
236 -
 237
237 -
 238
238 -
 239
239 -
 240
240 -
 241
241 -
 242
242 -
 243
243 -
 244
244 -
 245
245 -
 246
246 -
 247
247 -
 248
248 -
 249
249 -
 250
250 -
 251
251 -
252
-
253
-
254
-
255
-
256
-
257
-
258
-
259
-
260
-
261
-
262
-
263
-
264
-
265
-
266
-
267
-
268
 |
 |

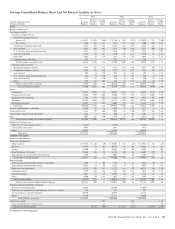
Average Consolidated Balance Sheet And Net Interest Analysis (a) (b) (c)
2014 2013 2012
Taxable-equivalent basis
Dollars in millions
Average
Balances
Interest
Income/
Expense
Average
Yields/
Rates
Average
Balances
Interest
Income/
Expense
Average
Yields/
Rates
Average
Balances
Interest
Income/
Expense
Average
Yields/
Rates
Assets
Interest-earning assets:
Investment securities
Securities available for sale
Residential mortgage-backed
Agency (d) $ 18,935 $ 503 2.66% $ 22,746 $ 562 2.47% $ 24,976 $ 725 2.90%
Non-agency 5,106 244 4.78 5,828 317 5.44 6,506 350 5.38
Commercial mortgage-backed (d) 5,461 192 3.52 5,228 222 4.25 5,228 246 4.71
Asset-backed 5,321 105 1.97 5,857 110 1.88 5,227 106 2.03
U.S. Treasury and government agencies 4,837 57 1.18 2,326 37 1.59 2,733 55 2.01
State and municipal 2,148 96 4.47 2,250 97 4.31 1,920 91 4.74
Other debt 2,016 52 2.58 2,632 64 2.43 3,019 82 2.72
Corporate stocks and other 402 – – 342 – – 350 – –
Total securities available for sale 44,226 1,249 2.82 47,209 1,409 2.98 49,959 1,655 3.31
Securities held to maturity
Residential mortgage-backed 5,885 207 3.52 4,374 153 3.50 4,423 156 3.53
Commercial mortgage-backed 2,502 99 3.96 3,422 151 4.41 4,288 195 4.55
Asset-backed 908 14 1.54 983 16 1.63 892 17 1.91
U.S. Treasury and government agencies 243 9 3.70 235 9 3.83 226 9 3.98
State and municipal 1,727 95 5.50 749 42 5.61 670 28 4.18
Other 329 10 3.04 347 11 3.17 358 10 2.79
Total securities held to maturity 11,594 434 3.74 10,110 382 3.78 10,857 415 3.82
Total investment securities 55,820 1,683 3.02 57,319 1,791 3.12 60,816 2,070 3.40
Loans
Commercial 92,411 3,029 3.28 86,047 3,243 3.77 76,654 3,447 4.50
Commercial real estate 22,646 919 4.06 19,469 937 4.81 18,115 1,005 5.55
Equipment lease financing 7,567 278 3.67 7,329 292 3.98 6,674 307 4.60
Consumer 62,529 2,609 4.17 62,125 2,744 4.42 59,752 2,801 4.69
Residential real estate 14,495 721 4.97 15,003 773 5.15 15,423 832 5.39
Total loans 199,648 7,556 3.78 189,973 7,989 4.21 176,618 8,392 4.75
Interest-earning deposits with banks 19,204 49 .26 4,910 12 .24 1,913 4 .21
Loans held for sale 2,123 99 4.66 2,909 157 5.40 2,977 168 5.64
Federal funds sold and resale agreements 1,446 5 .35 960 8 .83 1,594 22 1.38
Other 5,064 228 4.50 4,574 218 4.77 4,636 222 4.79
Total interest-earning assets/interest income 283,305 9,620 3.40 260,645 10,175 3.90 248,554 10,878 4.38
Noninterest-earning assets:
Allowance for loan and lease losses (3,482) (3,796) (4,157)
Cash and due from banks 3,945 3,953 3,877
Other 44,085 44,862 46,680
Total assets $327,853 $305,664 $294,954
Liabilities and Equity
Interest-bearing liabilities:
Interest-bearing deposits
Money market $ 75,513 $ 140 .19% $ 70,567 $ 128 .18% $ 65,933 $ 138 .21%
Demand 43,367 22 .05 40,144 18 .04 34,342 14 .04
Savings 11,990 14 .12 10,954 10 .09 9,863 9 .09
Retail certificates of deposit 19,636 145 .74 22,274 180 .81 26,609 210 .79
Time deposits in foreign offices and other time 2,308 4 .17 2,061 8 .39 3,195 15 .47
Total interest-bearing deposits 152,814 325 .21 146,000 344 .24 139,942 386 .28
Borrowed funds
Federal funds purchased and repurchase agreements 3,560 3 .08 3,884 6 .15 4,542 10 .22
Federal Home Loan Bank borrowings 14,863 73 .49 8,617 45 .52 9,678 72 .74
Bank notes and senior debt 14,114 202 1.43 11,221 191 1.70 10,275 236 2.30
Subordinated debt 8,559 219 2.56 7,373 205 2.78 7,019 320 4.56
Commercial paper 4,861 14 .29 6,902 16 .23 8,383 23 .27
Other 2,860 70 2.45 2,025 53 2.62 1,947 47 2.41
Total borrowed funds 48,817 581 1.19 40,022 516 1.29 41,844 708 1.69
Total interest-bearing liabilities/interest expense 201,631 906 .45 186,022 860 .46 181,786 1,094 .60
Noninterest-bearing liabilities and equity:
Noninterest-bearing deposits 70,108 66,168 61,610
Allowance for unfunded loan commitments and letters of credit 238 241 237
Accrued expenses and other liabilities 10,530 10,918 11,321
Equity 45,346 42,315 40,000
Total liabilities and equity $327,853 $305,664 $294,954
Interest rate spread 2.95 3.44 3.78
Impact of noninterest-bearing sources .13 .13 .16
Net interest income/margin $8,714 3.08% $ 9,315 3.57% $ 9,784 3.94%
(continued on following page)
The PNC Financial Services Group, Inc. – Form 10-K 223