PNC Bank 2014 Annual Report Download - page 188
Download and view the complete annual report
Please find page 188 of the 2014 PNC Bank annual report below. You can navigate through the pages in the report by either clicking on the pages listed below, or by using the keyword search tool below to find specific information within the annual report.-
 1
1 -
2
-
3
-
4
-
5
-
6
-
7
-
8
-
9
-
10
-
11
-
12
-
13
-
14
-
15
-
16
-
17
-
18
-
19
-
20
-
21
-
22
-
23
-
24
-
25
-
26
-
27
-
28
-
29
-
30
-
31
-
32
-
33
-
34
-
35
-
36
-
37
-
38
-
39
-
40
-
41
-
42
-
43
-
44
-
45
-
46
-
47
-
48
-
49
-
50
-
51
-
52
-
53
-
54
-
55
-
56
-
57
-
58
-
59
-
60
-
61
-
62
-
63
-
64
-
65
-
66
-
67
-
68
-
69
-
70
-
71
-
72
-
73
-
74
-
75
-
76
-
77
-
78
-
79
-
80
-
81
-
82
-
83
-
84
-
85
-
86
-
87
-
88
-
89
-
90
-
91
-
92
-
93
-
94
-
95
-
96
-
97
-
98
-
99
-
100
-
101
-
102
-
103
-
104
-
105
-
106
-
107
-
108
-
109
-
110
-
111
-
112
-
113
-
114
-
115
-
116
-
117
-
118
-
119
-
120
-
121
-
122
-
123
-
124
-
125
-
126
-
127
-
128
-
129
-
130
-
131
-
132
-
133
-
134
-
135
-
136
-
137
-
138
-
139
-
140
-
141
-
142
-
143
-
144
-
145
-
146
-
147
-
148
-
149
-
150
-
151
-
152
-
153
-
154
-
155
-
156
-
157
-
158
-
159
-
160
-
161
-
162
-
163
-
164
-
165
-
166
-
167
-
168
-
169
-
170
-
171
-
172
-
173
-
174
-
175
-
176
-
177
-
 178
178 -
 179
179 -
 180
180 -
 181
181 -
 182
182 -
 183
183 -
 184
184 -
 185
185 -
 186
186 -
 187
187 -
 188
188 -
 189
189 -
 190
190 -
 191
191 -
 192
192 -
 193
193 -
 194
194 -
 195
195 -
 196
196 -
 197
197 -
 198
198 -
199
-
200
-
201
-
202
-
203
-
204
-
205
-
206
-
207
-
208
-
209
-
210
-
211
-
212
-
213
-
214
-
215
-
216
-
217
-
218
-
219
-
220
-
221
-
222
-
223
-
224
-
225
-
226
-
227
-
228
-
229
-
230
-
231
-
232
-
233
-
234
-
235
-
236
-
237
-
238
-
239
-
240
-
241
-
242
-
243
-
244
-
245
-
246
-
247
-
248
-
249
-
250
-
251
-
252
-
253
-
254
-
255
-
256
-
257
-
258
-
259
-
260
-
261
-
262
-
263
-
264
-
265
-
266
-
267
-
268
 |
 |
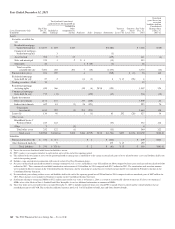
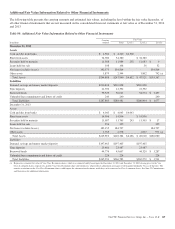
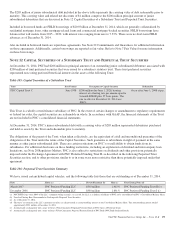
The aggregate fair values in the preceding table represent only
a portion of the total market value of PNC’s assets and
liabilities as, in accordance with the guidance related to fair
values of financial instruments, Table 90 excludes the
following:
• financial instruments recorded at fair value on a
recurring basis,
• real and personal property,
• lease financing,
• loan customer relationships,
• deposit customer intangibles,
• mortgage servicing rights,
• retail branch networks,
• fee-based businesses, such as asset management and
brokerage, and
• trademarks and brand names.
We used the following methods and assumptions to estimate
the fair value amounts for financial instruments included in
Table 90.
General
For short-term financial instruments realizable in three months
or less, the carrying amount reported on our Consolidated
Balance Sheet approximates fair value. Unless otherwise
stated, the rates used in discounted cash flow analyses are
based on market yield curves.
Cash and due from banks
The carrying amounts reported on our Consolidated Balance
Sheet for cash and due from banks approximate fair values.
For purposes of this disclosure only, cash and due from banks
includes the following:
• due from banks, and
• non-interest-earning deposits with banks.
Short-Term Assets
The carrying amounts reported on our Consolidated Balance
Sheet for short-term investments approximate fair values
primarily due to their short-term nature. For purposes of this
disclosure only, short-term assets include the following:
• federal funds sold and resale agreements,
• cash collateral,
• customers’ acceptances,
• accrued interest receivable, and
• interest-earning deposits with banks.
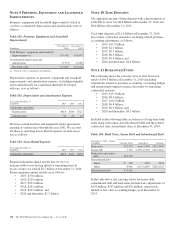
Securities held to maturity
We primarily use prices obtained from pricing services, dealer
quotes or recent trades to determine the fair value of
securities. As of December 31, 2014, 94% of the positions in
the held to maturity portfolio were priced by pricing services
provided by third-party vendors. Refer to the Fair Value
Measurement section of this Note 7 for additional information
relating to our pricing processes and procedures.
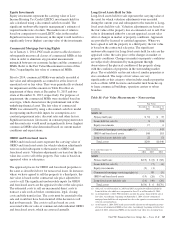
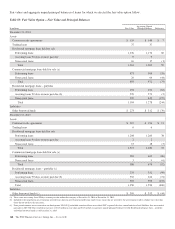
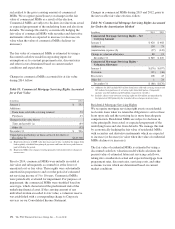
Net Loans And Loans Held For Sale
Fair values are estimated based on the discounted value of
expected net cash flows incorporating assumptions about
prepayment rates, net credit losses and servicing fees. For
purchased impaired loans, fair value is assumed to equal
PNC’s carrying value, which represents the present value of
expected future principal and interest cash flows, as adjusted
for any ALLL recorded for these loans. See Note 4 Purchased
Loans for additional information. For revolving home equity
loans and commercial credit lines, this fair value does not
include any amount for new loans or the related fees that will
be generated from the existing customer relationships.
Nonaccrual loans are valued at their estimated recovery value.
Loans are presented net of the ALLL and do not include future
accretable discounts related to purchased impaired loans.
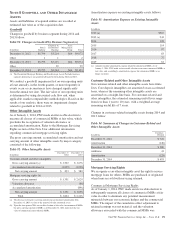
Other Assets
Other assets as shown in Table 90 includes equity investments
carried at cost as well as FHLB and FRB stock. The aggregate
carrying value of our FHLB and FRB stock was $1.8 billion at
December 31, 2014 and was $1.6 billion at December 31,
2013, which approximates fair value at each date.
Investments accounted for under the equity method, including
our investment in BlackRock, are not included in Table 90.
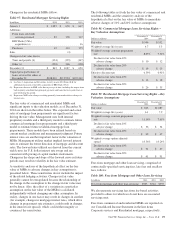
Deposits
For deposits with no defined maturity, such as noninterest-
bearing and interest-bearing demand and interest-bearing
money market and savings deposits, carrying values
approximate fair values. For time deposits, fair values are
estimated by discounting contractual cash flows using current
market rates for instruments with similar maturities. The value
of long-term relationships with depositors was not taken into
account in estimating fair values.
Borrowed Funds
For short-term borrowings, including Federal funds
purchased, commercial paper, repurchase agreements, and
certain other short-term borrowings and payables, carrying
values approximated fair values. For long-term borrowed
funds, quoted market prices are used, when available, to
estimate fair value. When quoted market prices are not
available, fair value is estimated based on current market
interest rates and credit spreads for debt with similar terms
and maturities.
Unfunded Loan Commitments And Letters Of Credit
The fair value of unfunded loan commitments and letters of
credit is determined from a market participant’s view
including the impact of changes in interest rates and credit.
Because our obligation on substantially all unfunded loan
commitments and letters of credit varies with changes in
interest rates, these instruments are subject to little fluctuation
in fair value due to changes in interest rates. We establish a
liability on these facilities related to the creditworthiness of
our counterparty.
170 The PNC Financial Services Group, Inc. – Form 10-K