PNC Bank 2014 Annual Report Download - page 203
Download and view the complete annual report
Please find page 203 of the 2014 PNC Bank annual report below. You can navigate through the pages in the report by either clicking on the pages listed below, or by using the keyword search tool below to find specific information within the annual report.-
 1
1 -
2
-
3
-
4
-
5
-
6
-
7
-
8
-
9
-
10
-
11
-
12
-
13
-
14
-
15
-
16
-
17
-
18
-
19
-
20
-
21
-
22
-
23
-
24
-
25
-
26
-
27
-
28
-
29
-
30
-
31
-
32
-
33
-
34
-
35
-
36
-
37
-
38
-
39
-
40
-
41
-
42
-
43
-
44
-
45
-
46
-
47
-
48
-
49
-
50
-
51
-
52
-
53
-
54
-
55
-
56
-
57
-
58
-
59
-
60
-
61
-
62
-
63
-
64
-
65
-
66
-
67
-
68
-
69
-
70
-
71
-
72
-
73
-
74
-
75
-
76
-
77
-
78
-
79
-
80
-
81
-
82
-
83
-
84
-
85
-
86
-
87
-
88
-
89
-
90
-
91
-
92
-
93
-
94
-
95
-
96
-
97
-
98
-
99
-
100
-
101
-
102
-
103
-
104
-
105
-
106
-
107
-
108
-
109
-
110
-
111
-
112
-
113
-
114
-
115
-
116
-
117
-
118
-
119
-
120
-
121
-
122
-
123
-
124
-
125
-
126
-
127
-
128
-
129
-
130
-
131
-
132
-
133
-
134
-
135
-
136
-
137
-
138
-
139
-
140
-
141
-
142
-
143
-
144
-
145
-
146
-
147
-
148
-
149
-
150
-
151
-
152
-
153
-
154
-
155
-
156
-
157
-
158
-
159
-
160
-
161
-
162
-
163
-
164
-
165
-
166
-
167
-
168
-
169
-
170
-
171
-
172
-
173
-
174
-
175
-
176
-
177
-
178
-
179
-
180
-
181
-
182
-
183
-
184
-
185
-
186
-
187
-
188
-
189
-
190
-
191
-
192
-
 193
193 -
 194
194 -
 195
195 -
 196
196 -
 197
197 -
 198
198 -
 199
199 -
 200
200 -
 201
201 -
 202
202 -
 203
203 -
 204
204 -
 205
205 -
 206
206 -
 207
207 -
 208
208 -
 209
209 -
 210
210 -
 211
211 -
 212
212 -
 213
213 -
214
-
215
-
216
-
217
-
218
-
219
-
220
-
221
-
222
-
223
-
224
-
225
-
226
-
227
-
228
-
229
-
230
-
231
-
232
-
233
-
234
-
235
-
236
-
237
-
238
-
239
-
240
-
241
-
242
-
243
-
244
-
245
-
246
-
247
-
248
-
249
-
250
-
251
-
252
-
253
-
254
-
255
-
256
-
257
-
258
-
259
-
260
-
261
-
262
-
263
-
264
-
265
-
266
-
267
-
268
 |
 |

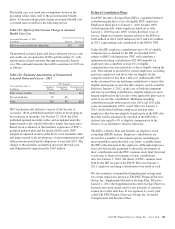
To determine stock-based compensation expense, the grant
date fair value is applied to the options granted with a
reduction for estimated forfeitures. We recognize
compensation expense for stock options on a straight-line
basis over the specified vesting period.
At December 31, 2013 and 2012, options for 10,204,000 and
12,759,000 shares of common stock were exercisable at a
weighted-average price of $89.46 and $90.86, respectively.
The total intrinsic value of options exercised during 2014,
2013 and 2012 was $90 million, $86 million and $37 million,
respectively.
Cash received from option exercises under all Incentive Plans
for 2014, 2013 and 2012 was approximately $215 million,
$208 million and $118 million, respectively. The tax benefit
realized from option exercises under all Incentive Plans for
2014, 2013 and 2012 was approximately $33 million, $31
million and $14 million, respectively.
Shares of common stock available during the next year for the
granting of options and other awards under the Incentive Plans
were 17,997,353 at December 31, 2014. Total shares of PNC
common stock authorized for future issuance under equity
compensation plans totaled 19,017,057 shares at
December 31, 2014, which includes shares available for
issuance under the Incentive Plans and the Employee Stock
Purchase Plan (ESPP) as described below.
During 2014, we issued approximately 2.4 million shares from
treasury stock in connection with stock option exercise
activity. As with past exercise activity, we currently intend to
utilize primarily treasury stock for any future stock option
exercises.
Awards granted to non-employee directors in 2014, 2013 and
2012 include 21,490, 27,076 and 25,620 deferred stock units,
respectively, awarded under the Outside Directors Deferred
Stock Unit Plan. A deferred stock unit is a phantom share of
our common stock, which is accounted for as a liability until
such awards are paid to the participants in cash. As there are
no vesting or service requirements on these awards, total
compensation expense is recognized in full for these awards
on the date of grant.
Incentive/Performance Unit Share Awards and
Restricted Stock/Share Unit Awards
The fair value of nonvested incentive/performance unit share
awards and restricted stock/share unit awards is initially
determined based on prices not less than the market value of
our common stock on the date of grant. The value of certain
incentive/performance unit share awards is subsequently
remeasured based on the achievement of one or more financial
and other performance goals. The Personnel and
Compensation Committee (“P&CC”) of the Board of
Directors approves the final award payout with respect to
certain incentive/performance unit share awards. These
awards have either a three-year or a four-year performance
period and are payable in either stock or a combination of
stock and cash. Restricted stock/share unit awards have
various vesting periods generally ranging from 3 years to 5
years.
Beginning in 2013, we incorporated several enhanced risk-
related performance changes to certain long-term incentive
compensation programs. In addition to achieving certain
financial performance metrics on both an absolute basis and
relative to our peers, final payout amounts will be subject to
reduction if PNC fails to meet certain risk-related performance
metrics as specified in the award agreements. However, the
P&CC has the discretion to waive any or all of this reduction
under certain circumstances.
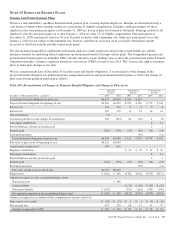
The weighted-average grant date fair value of incentive/
performance unit share awards and restricted stock/unit
awards granted in 2014, 2013 and 2012 was $80.79, $64.77
and $60.68 per share, respectively. The total fair value of
incentive/performance unit share and restricted stock/unit
awards vested during 2014, 2013 and 2012 was approximately
$119 million, $63 million and $55 million, respectively. We
recognize compensation expense for such awards ratably over
the corresponding vesting and/or performance periods for each
type of program.
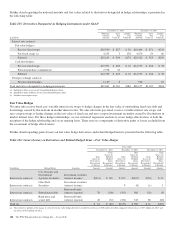
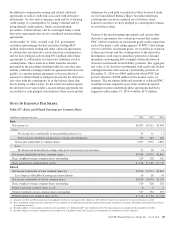
Table 121: Nonvested Incentive/Performance Unit Share
Awards and Restricted Stock/Share Unit Awards –
Rollforward
Shares in thousands
Nonvested
Incentive/
Performance
Unit Shares
Weighted-
Average
Grant Date
Fair Value
Nonvested
Restricted
Stock/
Share
Units
Weighted-
Average
Grant Date
Fair Value
December 31, 2013 1,647 $63.49 3,483 $62.70
Granted 723 79.90 1,276 81.29
Vested/Released (513) 63.64 (962) 62.32
Forfeited (20) 69.18 (145) 69.44
December 31, 2014 1,837 $69.84 3,652 $69.03
The PNC Financial Services Group, Inc. – Form 10-K 185