PNC Bank 2014 Annual Report Download - page 158
Download and view the complete annual report
Please find page 158 of the 2014 PNC Bank annual report below. You can navigate through the pages in the report by either clicking on the pages listed below, or by using the keyword search tool below to find specific information within the annual report.-
 1
1 -
2
-
3
-
4
-
5
-
6
-
7
-
8
-
9
-
10
-
11
-
12
-
13
-
14
-
15
-
16
-
17
-
18
-
19
-
20
-
21
-
22
-
23
-
24
-
25
-
26
-
27
-
28
-
29
-
30
-
31
-
32
-
33
-
34
-
35
-
36
-
37
-
38
-
39
-
40
-
41
-
42
-
43
-
44
-
45
-
46
-
47
-
48
-
49
-
50
-
51
-
52
-
53
-
54
-
55
-
56
-
57
-
58
-
59
-
60
-
61
-
62
-
63
-
64
-
65
-
66
-
67
-
68
-
69
-
70
-
71
-
72
-
73
-
74
-
75
-
76
-
77
-
78
-
79
-
80
-
81
-
82
-
83
-
84
-
85
-
86
-
87
-
88
-
89
-
90
-
91
-
92
-
93
-
94
-
95
-
96
-
97
-
98
-
99
-
100
-
101
-
102
-
103
-
104
-
105
-
106
-
107
-
108
-
109
-
110
-
111
-
112
-
113
-
114
-
115
-
116
-
117
-
118
-
119
-
120
-
121
-
122
-
123
-
124
-
125
-
126
-
127
-
128
-
129
-
130
-
131
-
132
-
133
-
134
-
135
-
136
-
137
-
138
-
139
-
140
-
141
-
142
-
143
-
144
-
145
-
146
-
147
-
 148
148 -
 149
149 -
 150
150 -
 151
151 -
 152
152 -
 153
153 -
 154
154 -
 155
155 -
 156
156 -
 157
157 -
 158
158 -
 159
159 -
 160
160 -
 161
161 -
 162
162 -
 163
163 -
 164
164 -
 165
165 -
 166
166 -
 167
167 -
 168
168 -
169
-
170
-
171
-
172
-
173
-
174
-
175
-
176
-
177
-
178
-
179
-
180
-
181
-
182
-
183
-
184
-
185
-
186
-
187
-
188
-
189
-
190
-
191
-
192
-
193
-
194
-
195
-
196
-
197
-
198
-
199
-
200
-
201
-
202
-
203
-
204
-
205
-
206
-
207
-
208
-
209
-
210
-
211
-
212
-
213
-
214
-
215
-
216
-
217
-
218
-
219
-
220
-
221
-
222
-
223
-
224
-
225
-
226
-
227
-
228
-
229
-
230
-
231
-
232
-
233
-
234
-
235
-
236
-
237
-
238
-
239
-
240
-
241
-
242
-
243
-
244
-
245
-
246
-
247
-
248
-
249
-
250
-
251
-
252
-
253
-
254
-
255
-
256
-
257
-
258
-
259
-
260
-
261
-
262
-
263
-
264
-
265
-
266
-
267
-
268
 |
 |

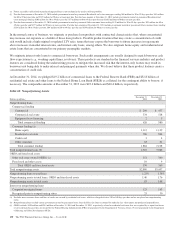
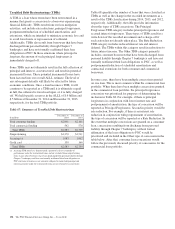
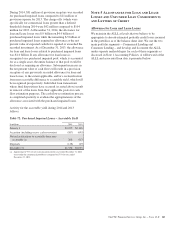
TDRs may result in charge-offs and interest income not being
recognized. The amount of principal balance charged off at or
around the time of modification for the twelve months ended
December 31, 2014 was not material. A financial effect of rate
reduction TDRs is that interest income is not recognized for
the difference between the original contractual interest rate
terms and the restructured terms. Interest income not
recognized that otherwise would have been earned in the
twelve months ended December 31, 2014 and 2013, related to
all commercial TDRs and consumer TDRs, was not material.
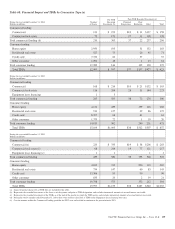
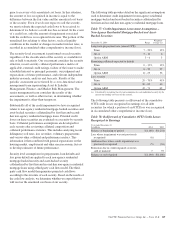
After a loan is determined to be a TDR, we continue to track
its performance under its most recent restructured terms. In
Table 69, we consider a TDR to have subsequently defaulted
when it becomes 60 days past due after the most recent date
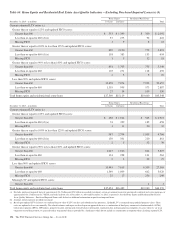
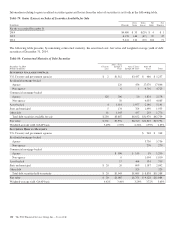
the loan was restructured. The following table presents the
recorded investment of loans that both (i) were classified as
TDRs or were subsequently modified during each 12-month
period preceding January 1, 2014, 2013, and 2012,
respectively, and (ii) subsequently defaulted during 2014,
2013, and 2012, respectively.
Table 69: TDRs that were Modified in the Past Twelve
Months which have Subsequently Defaulted
During the year ended
December 31, 2014
Dollars in millions Number of Contracts Recorded Investment
Commercial lending
Commercial 38 $ 26
Commercial real estate 43 80
Total commercial lending (a) 81 106
Consumer lending
Home equity 400 21
Residential real estate 155 24
Credit card 3,397 27
Other consumer 132 1
Total consumer lending 4,084 73
Total TDRs 4,165 $179
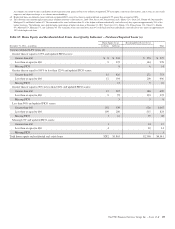
During the year ended
December 31, 2013
Dollars in millions Number of Contracts Recorded Investment
Commercial lending
Commercial 67 $ 47
Commercial real estate 38 59
Total commercial lending (a) 105 106
Consumer lending (b)
Home equity 592 39
Residential real estate 255 35
Credit card 4,598 34
Other consumer 249 4
Total consumer lending 5,694 112
Total TDRs 5,799 $218
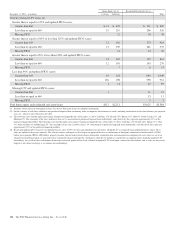
During the year ended
December 31, 2012
Dollars in millions Number of Contracts Recorded Investment
Commercial lending
Commercial (c) 112 $ 67
Commercial real estate (c) 42 69
Equipment lease financing 1 1
Total commercial lending 155 137
Consumer lending
Home equity 542 50
Residential real estate 482 70
Credit card 4,551 32
Other consumer 118 4
Total consumer lending 5,693 156
Total TDRs 5,848 $293
(a) During 2014 and 2013, there were no loans classified as TDRs in the Equipment
lease financing loan class that have subsequently defaulted.
(b) In the second quarter of 2014, we corrected our Consumer lending subsequent
default (excluding credit card) determination process by further refining the data.
For the twelve months ended December 31, 2013, this correction removed 1,426
contracts for approximately $130 million from Total consumer lending (excluding
credit card).
(c) Certain amounts within the 2012 Commercial lending portfolio were reclassified
during the fourth quarter of 2013.
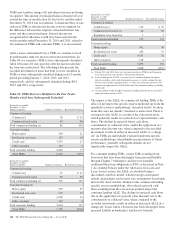
The impact to the ALLL for commercial lending TDRs is the
effect of moving to the specific reserve methodology from the
quantitative reserve methodology, described below, for those
loans that were not already classified as nonaccrual. There is
an impact to the ALLL as a result of the concession made,
which generally results in a reduction of expected future cash
flows. The decline in expected future cash flows,
consideration of collateral value, and/or the application of a
present value discount rate, when compared to the recorded
investment, results in either an increased ALLL or a charge-
off. As TDRs are individually evaluated under the specific
reserve methodology, which builds in expectations of future
performance, generally subsequent defaults do not
significantly impact the ALLL.
For consumer lending TDRs, except TDRs resulting from
borrowers that have been discharged from personal liability
through Chapter 7 bankruptcy and have not formally
reaffirmed their loan obligations to PNC as discussed in Note
1 Accounting Policies under the Allowance for Loans and
Lease Losses section, the ALLL is calculated using a
discounted cash flow model, which leverages subsequent
default, prepayment, and severity rate assumptions based upon
historically observed data. Similar to the commercial lending
specific reserve methodology, the reduced expected cash
flows resulting from the concessions granted impact the
consumer lending ALLL. The decline in expected cash flows
due to the application of a present value discount rate or the
consideration of collateral value, when compared to the
recorded investment, results in either an increased ALLL or a
charge-off. Loans where a borrower has been discharged from
personal liability in bankruptcy and has not formally
140 The PNC Financial Services Group, Inc. – Form 10-K