PNC Bank 2014 Annual Report Download - page 248
Download and view the complete annual report
Please find page 248 of the 2014 PNC Bank annual report below. You can navigate through the pages in the report by either clicking on the pages listed below, or by using the keyword search tool below to find specific information within the annual report.-
 1
1 -
2
-
3
-
4
-
5
-
6
-
7
-
8
-
9
-
10
-
11
-
12
-
13
-
14
-
15
-
16
-
17
-
18
-
19
-
20
-
21
-
22
-
23
-
24
-
25
-
26
-
27
-
28
-
29
-
30
-
31
-
32
-
33
-
34
-
35
-
36
-
37
-
38
-
39
-
40
-
41
-
42
-
43
-
44
-
45
-
46
-
47
-
48
-
49
-
50
-
51
-
52
-
53
-
54
-
55
-
56
-
57
-
58
-
59
-
60
-
61
-
62
-
63
-
64
-
65
-
66
-
67
-
68
-
69
-
70
-
71
-
72
-
73
-
74
-
75
-
76
-
77
-
78
-
79
-
80
-
81
-
82
-
83
-
84
-
85
-
86
-
87
-
88
-
89
-
90
-
91
-
92
-
93
-
94
-
95
-
96
-
97
-
98
-
99
-
100
-
101
-
102
-
103
-
104
-
105
-
106
-
107
-
108
-
109
-
110
-
111
-
112
-
113
-
114
-
115
-
116
-
117
-
118
-
119
-
120
-
121
-
122
-
123
-
124
-
125
-
126
-
127
-
128
-
129
-
130
-
131
-
132
-
133
-
134
-
135
-
136
-
137
-
138
-
139
-
140
-
141
-
142
-
143
-
144
-
145
-
146
-
147
-
148
-
149
-
150
-
151
-
152
-
153
-
154
-
155
-
156
-
157
-
158
-
159
-
160
-
161
-
162
-
163
-
164
-
165
-
166
-
167
-
168
-
169
-
170
-
171
-
172
-
173
-
174
-
175
-
176
-
177
-
178
-
179
-
180
-
181
-
182
-
183
-
184
-
185
-
186
-
187
-
188
-
189
-
190
-
191
-
192
-
193
-
194
-
195
-
196
-
197
-
198
-
199
-
200
-
201
-
202
-
203
-
204
-
205
-
206
-
207
-
208
-
209
-
210
-
211
-
212
-
213
-
214
-
215
-
216
-
217
-
218
-
219
-
220
-
221
-
222
-
223
-
224
-
225
-
226
-
227
-
228
-
229
-
230
-
231
-
232
-
233
-
234
-
235
-
236
-
237
-
 238
238 -
 239
239 -
 240
240 -
 241
241 -
 242
242 -
 243
243 -
 244
244 -
 245
245 -
 246
246 -
 247
247 -
 248
248 -
 249
249 -
 250
250 -
 251
251 -
 252
252 -
 253
253 -
 254
254 -
 255
255 -
 256
256 -
 257
257 -
 258
258 -
259
-
260
-
261
-
262
-
263
-
264
-
265
-
266
-
267
-
268
 |
 |
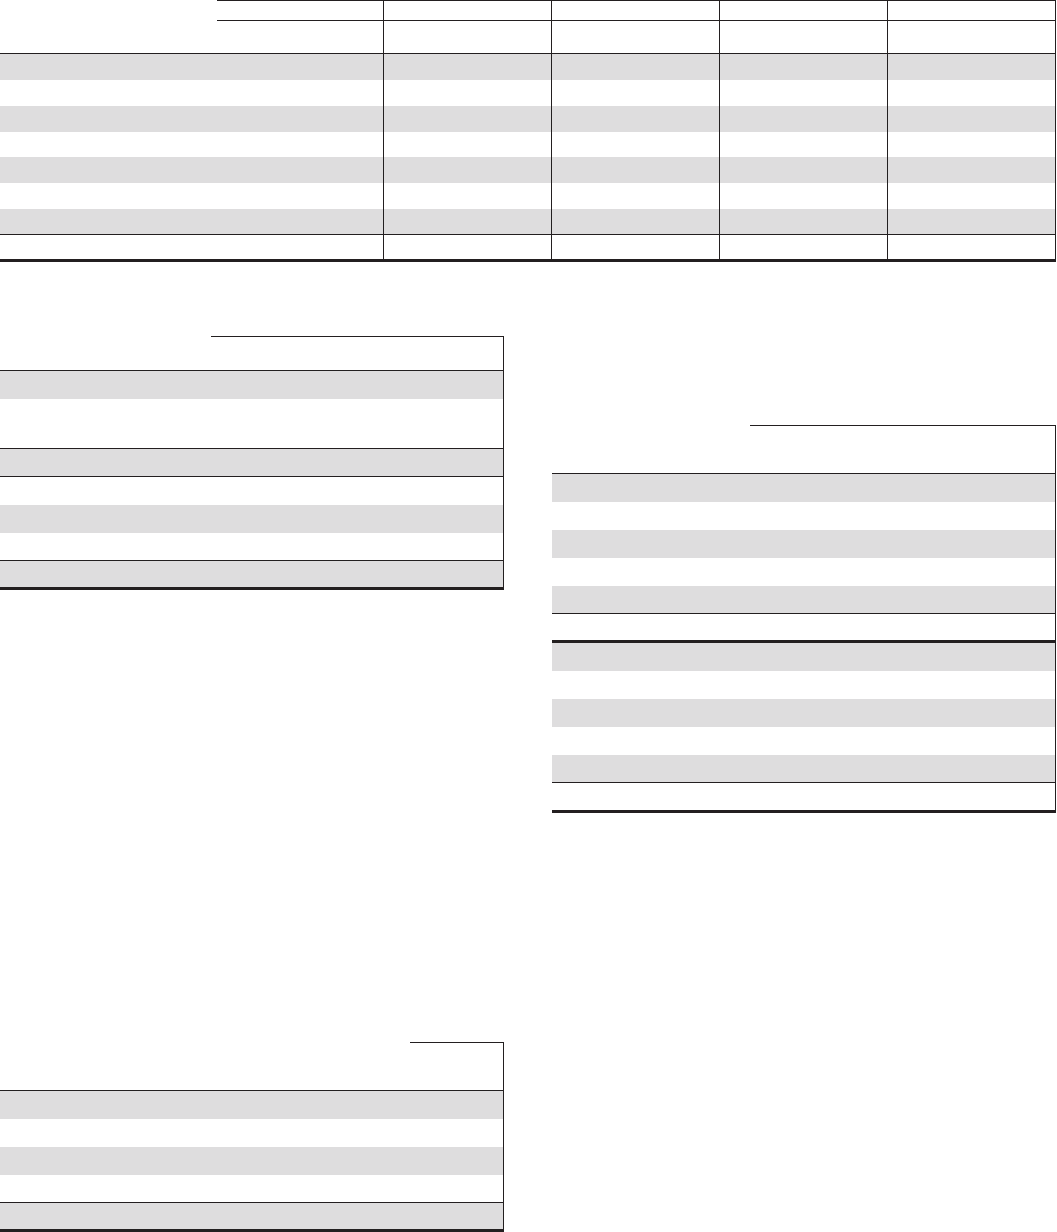
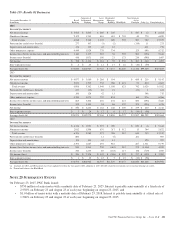
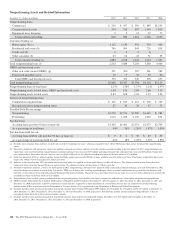
The following table presents the assignment of the allowance for loan and lease losses and the categories of loans as a percentage
of total loans. Changes in the allocation over time reflect the changes in loan portfolio composition, risk profile and refinements to
reserve methodologies.
Allocation of Allowance for Loan and Lease Losses
2014 2013 2012 2011 2010
December 31
Dollars in millions Allowance
Loans to
Total Loans Allowance
Loans to
Total Loans Allowance
Loans to
Total Loans Allowance
Loans to
Total Loans Allowance
Loans to
Total Loans
Commercial $1,209 47.6% $1,100 45.2% $1,131 44.7% $1,180 41.3% $1,387 36.7%
Commercial real estate 318 11.4 400 10.8 589 10.0 753 10.2 1,086 11.9
Equipment lease financing 44 3.7 47 3.9 54 3.9 62 4.0 94 4.2
Home equity 872 16.9 1,051 18.6 1,044 19.3 1,095 20.8 684 22.7
Residential real estate 561 7.0 642 7.7 847 8.2 894 9.1 1,093 10.6
Credit card 173 2.3 169 2.3 199 2.3 202 2.5 361 2.6
Other consumer 154 11.1 200 11.5 172 11.6 161 12.1 182 11.3
Total $3,331 100.0% $3,609 100.0% $4,036 100.0% $4,347 100.0% $4,887 100.0%
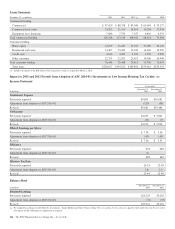
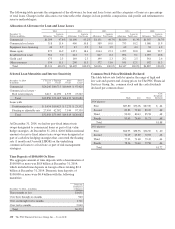
Selected Loan Maturities and Interest Sensitivity
December 31, 2014
In millions
1 Year or
Less
1 Through
5 Years
After
5 Years
Gross
Loans
Commercial $26,245 $60,715 $10,460 $ 97,420
Commercial real estate –
Real estate projects 6,613 12,290 4,359 23,262
Total $32,858 $73,005 $14,819 $120,682
Loans with:
Predetermined rate $ 5,454 $10,623 $ 7,275 $ 23,352
Floating or adjustable rate 27,404 62,382 7,544 97,330
Total $32,858 $73,005 $14,819 $120,682
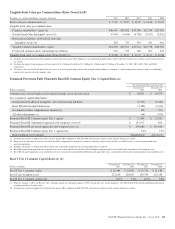
At December 31, 2014, we had no pay-fixed interest rate
swaps designated to commercial loans as part of fair value
hedge strategies. At December 31, 2014, $20.0 billion notional
amount of receive-fixed interest rate swaps were designated as
part of cash flow hedging strategies that converted the floating
rate (1 month and 3 month LIBOR) on the underlying
commercial loans to a fixed rate as part of risk management
strategies.
Time Deposits of $100,000 Or More
The aggregate amount of time deposits with a denomination of
$100,000 or more was $8.8 billion at December 31, 2014,
which included time deposits in foreign offices totaling $2.4
billion at December 31, 2014. Domestic time deposits of
$100,000 or more were $6.4 billion with the following
maturities:
December 31, 2014 – in millions
Domestic
Certificates
of Deposit
Three months or less $1,651
Over three through six months 960
Over six through twelve months 1,721
Over twelve months 2,040
Total $6,372
Common Stock Prices/Dividends Declared
The table below sets forth by quarter the range of high and
low sale and quarter-end closing prices for The PNC Financial
Services Group, Inc. common stock and the cash dividends
declared per common share.
High Low Close
Cash
Dividends
Declared
2014 Quarter
First $87.80 $76.06 $87.00 $ .44
Second 89.85 79.80 89.05 .48
Third 90.00 80.43 85.58 .48
Fourth 93.45 76.69 91.23 .48
Total $1.88
2013 Quarter
First $66.93 $58.96 $66.50 $ .40
Second 74.19 63.69 72.92 .44
Third 77.93 71.48 72.45 .44
Fourth 78.36 70.63 77.58 .44
Total $1.72
230 The PNC Financial Services Group, Inc. – Form 10-K